Tak się zastanawiamy, czemu temat zboża (w kontekście biologicznym i zagrożeń zdrowotnych) nie “ssie” obecnie w Polsce (mimo kampanii wyborczej i sytuacji wokół 15 września czyli zniesienia unijnego embarga).
Zainteresowanie frazami bezpieczeństwo żywnościowe, zatrute zboże, czy pestycydy (w kontekście żywności) – brak grzania tematu po 15.09
Prawdopodobnie, dlatego iż PO i PiS tak samo jak większość małych partii mają tą samą agendę wyborczą (nie wpuszczać zboża). Więc nie ma potencjału polaryzacyjnego skąd prawdopodobnie wywiad białoruski (działający na zlecenie rosyjskiego) nie wykorzystuje tematu (ze względu na skończone zasoby i inne obszary o większym potencjale polaryzacyjnym).
Daje to miejsce działania dyplomacji (może też wywiadów) niemieckiej i ukraińskiej.
Warto zauważyć, że ze Słowakami (znacznie większe znaczenie dyskursu zagrożeń biologicznych w opozycji), Węgrami (temat nie istnieje, ze względu na powszechną akceptację zakazu) i Rumunami (temat zepchnięty na dalszy plan, przez naruszanie przestrzeni powietrznej kraju) ta sprawa była inaczej rozgrywana (potencjalnie przez służby rosyjskie) i to bardzo ciekawie geopolitycznie wygląda.
Od ok 17.08 mamy do czynienia z epidemią legionellozy w Województwie Podkarpackim.
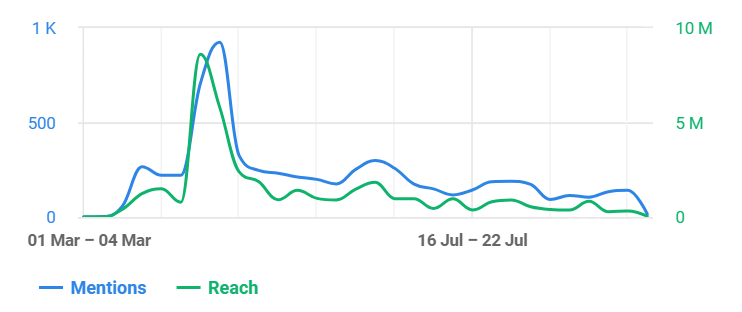
Przebieg zainteresowania frazą legionella w mediach tradycyjnych i społecznościowych (zasięg i liczebność wzmianek dziennie)
Przebieg zainteresowania przedstawia się się następująco:
18-21.08 zainteresowanie w lokalnych mediach społecznościowych i tradycyjnych;
22.08 zainteresowanie mediów branżowych i kont na mediach społecznościowych zajmujących się medycyną;
23-24.08 eskalacja w mediach głównego nurtu (wciąż małe upolitycznienie sytuacji, m.in. z powodu tego iż w województwie podkarpackim nie ma konfliktu między delegaturami administracji rządowej z administracją samorządową).
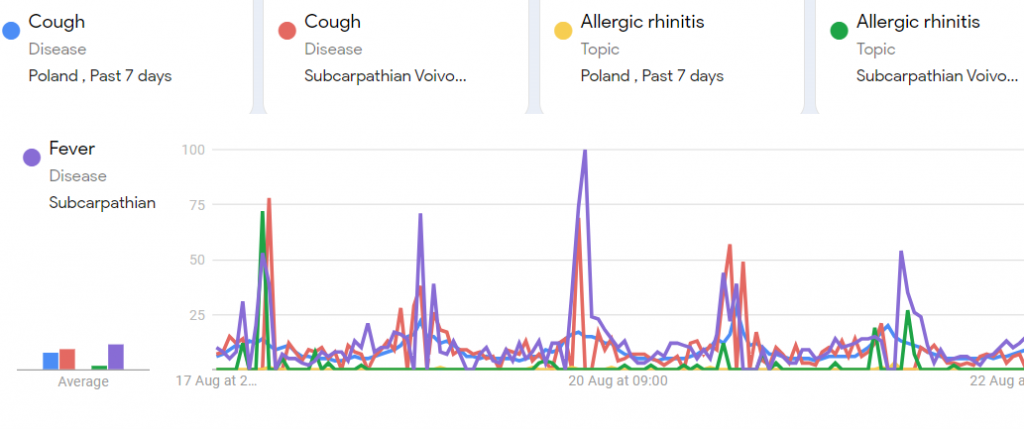
Po uwzględnieniu okresu inkubacji choroby, oraz uwzględnieniu, że między 9-17.08 w okolicy Rzeszowa nie było opadów a temperatura w ciągu dnia przekraczała w najcieplejszych godzinach dnia 30 st. C, to punktowe skażenia wody, bądź klimatyzacji wydaje się najbardziej prawdopodobnym źródłem. W dniach 17-20.08 zapytania o symptomy grypopodobne (zwłaszcza „alergiczny nieżyt nosa”, który mogą pacjenci mylić z zakażeniem legionellą), wzrasta w województwie podkarpackim (co można uważać za szczyt epidemii w społeczeństwie jeżeli zakładamy że większość populacji przechodzi ją skąpoobjawowo).
Porównanie liczności zapytań w Google między różnymi tematami związanymi z ogniskiem (symptomalnych) https://trends.google.com/trends/explore?date=now%207-d,now%207-d,now%207-d,now%207-d,now%207-d&geo=PL,PL-PK,PL,PL-PK,PL-PK&q=%2Fm%2F01b_21,%2Fm%2F01b_21,%2Fm%2F0c01msq,%2Fm%2F0c01msq,%2Fm%2F0cjf0&hl=en-GB
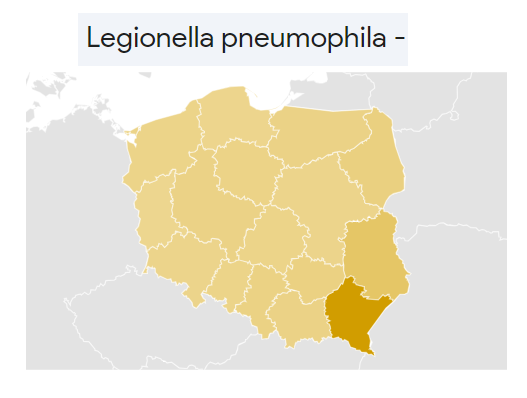
Póki co przypadki koncentrują się w Rzeszowie i nie ma zakażeń poza województwem podkarpackim (https://www.gov.pl/web/psse-rzeszow/komunikat-panstwowego-powiatowego-inspektora-sanitarnego-w-rzeszowie-w-sprawie-ogniska-wywolanego-zakazeniem-legionella-pneumophila), ale zainteresowanie problemem rozlewa się na całą ścianę wschodnią (co może być związane z wątkiem wojennym). Zgodnie ze oceną stanu sanitarnego województwa Podkarpackiego za rok 2022 bakteria ta była obecna w ośrodkach służby zdrowia (423 przebadanych próbek) oraz znaleziono 19 dodatnich próbek w nieckach jacuzzi oraz z prysznicy. Nie zauważono problemu bezpośrednio w sieci wodno-kanalizacyjnej, w miejscach publicznych (poza wymienionymi 2 wyjątkami) . Dziwić może fakt braku przeprowadzenia badań molekularnych z próbek ze środowiska oraz wykorzystania technik informacyjnych, np. klastrowania trajektorii przestrzenno-czasowych dodatnich pacjentów z ich stacji logowania telefonii komórkowej.
Geografia zapytań o bakterię w Google
Mimo potencjału związanego z bioterroryzmem, czy niechęcią wobec Ukraińców (na których można łatwo zrzucić podejrzenia o siewstwo), na chwilą obecną komunikaty antyukraińskie nie przebijają się poza swoją bańkę medialną. Ze względów kulturowych, raczej podejrzenia nie padną na przetaczające się przez Rzeszów wojska sojusznicze.
Porównanie liczności zapytań w Google między różnymi tematami związanymi z ogniskiem (https://trends.google.com/trends/explore?date=now%207-d,now%207-d,now%207-d,now%207-d&geo=PL,PL,PL,PL-PK&q=%2Fm%2F09rqh7w,%2Fm%2F01btjj,%2Fm%2F03zj32,%2Fm%2F012f86&hl=en-GB )
W przypadku dalszego wzrostu liczby zakażeń lub zgonów oraz braku postępów w dochodzeniu epidemiologicznym może dojść do dopompowania tematu przez obce służby, uderzając w aparat sanitarno-epidemiologiczny państwa (utożsamiany z obecną partią rządzącą).
Przykład dezinformacji związanej ze społecznością ukraińskich uchodźców oraz rehabilitujących się w regionie weteranów wojennych
Od tej pory temat nabiera już międzynarodowego wymiaru (23.08 https://promedmail.org/promed-post/?id=8711806 z 74 hospitalizacjami). Naszym zdaniem, ze względu na wciąż lokalny charakter epidemii, aktywa zewnętrzne się nie włączyły (w przeciwieństwie do przebiegu narracji o “zatrutym zbożu”), ale ze względu na kampanię wyborczą można się tego spodziewać, jeżeli ognisko nie wygaśnie.
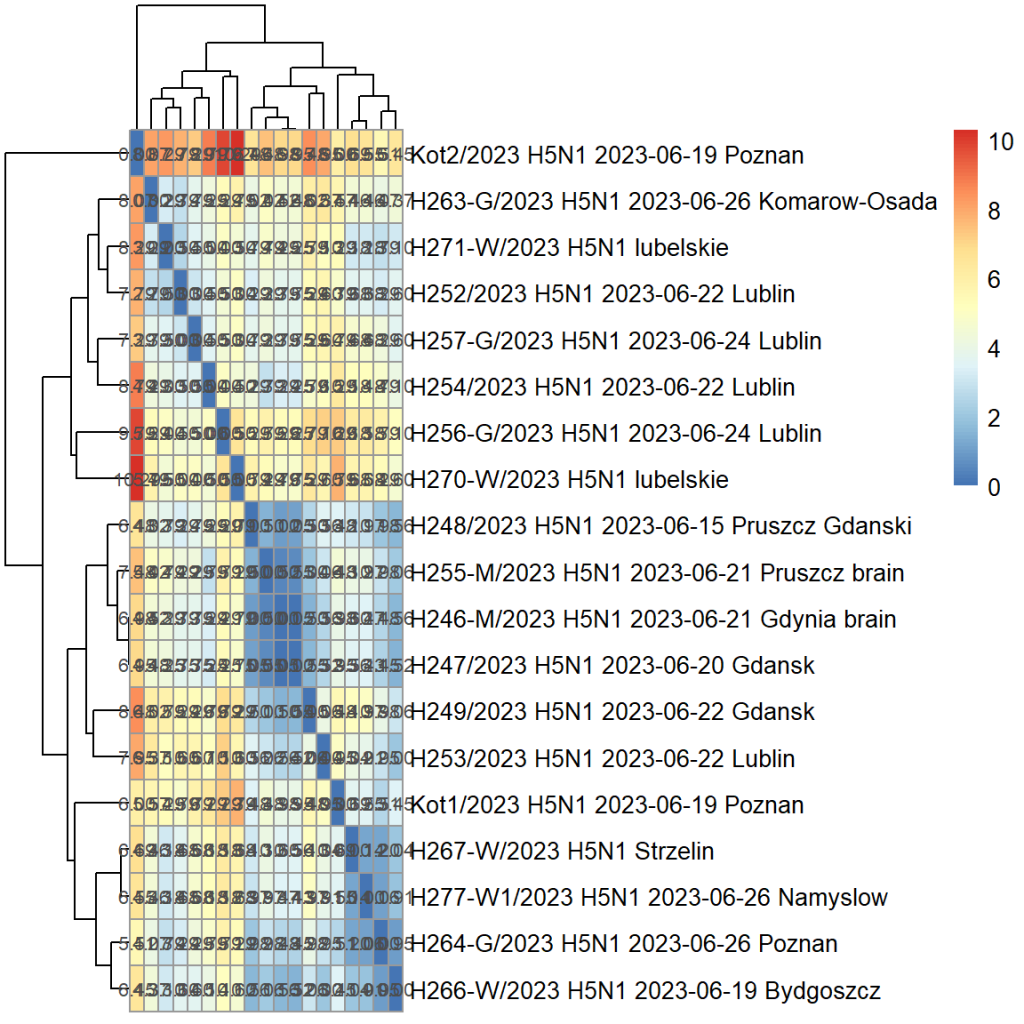
We can speculate in the letter above that spatiotemporal patterns inferred by epigenetics support wild birds hypothesis of AI introduction into cats population.
DBscan of 19 spatio-genetic-temporal related infrctions
Przebieg epizootii wygląda na wygasający, ale ze względu na nieścisłości między różnymi komunikatami GLW a danymi prezentowanymi przez ECDC (np.+1 przypadek z SGGW) i WHO (+przypadki z UJ i WUM) warto zachować pewną ostrożność. Wyniki pozytywne oraz zliczenia próbek nie zostały podane jawnie i jedynie można próbować wydedukować jaki jest rzeczywisty przebieg (możliwa błędna interpretacja, bo komunikaty GLW są nieścisłe).
Wygląda na to że, w zależności od tego kto raportował, to przypadki stwierdzone poza PIWet-em była zgłasza lub nie. Wartości liczby badanych przypadków w korektach dla ECDC i WHO są tylko wartościami szacowanymi (na podstawie skumulowanej liczby przypadków pozytywnych), bo nie sumują się do liczby próbek z innych komunikatów. Z kolejnych komunikatów o liczbach skumulowanych przypadków, wydaje się że 2 przypadki zostały zarejestrowane między 28-30.06. Oczywiście mogło się zdarzyć, że GLW przekazał błędne dane do WHO lub/i ECDC lub instytucja międzynarodowa się pomyliła w swoich analizach (a komunikat z ECDC na to wskazuje).
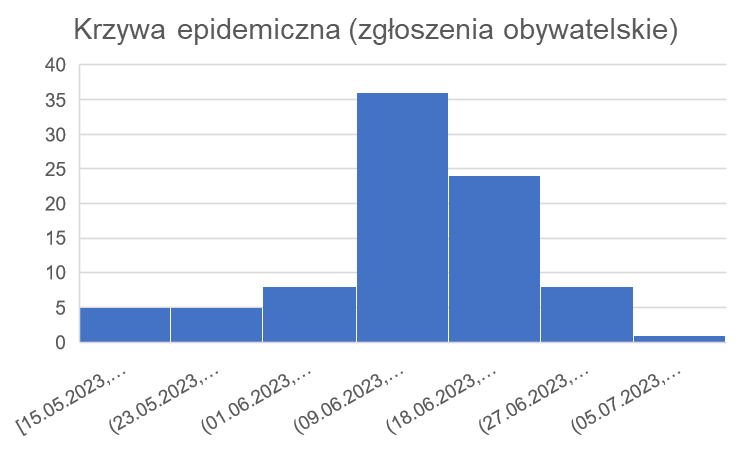
Ze względu na brak danych oficjalnych dokładnych z uwzględnieniem czasu i miejsca pobrania materiału, a jedynie przedstawienie danych zagregowanych przez służby państwowe, warto przyjrzeć się danym nieoficjalnym.
Wykres zgłoszeń przypadków śmiertelnych o patologii podobnej do typowego przebiegu co u upadków potwierdzonych laboratoryjnie na obecność A/H5N1 (z grupy https://www.facebook.com/groups/1382403905988672)
Na podstawie tych źródeł (oba mają swoje wady i zalety), wydaje się jednak iż epizootia już minęła fazę kulminacyjną i jest w fazie wygaszania.
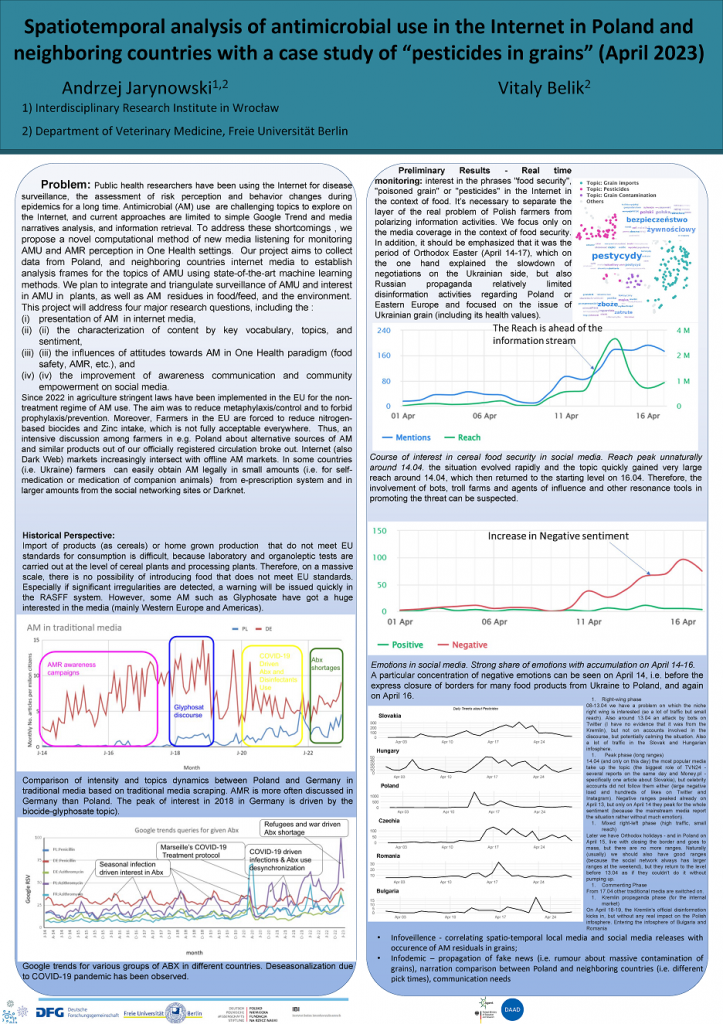
Powstał plakat: Przestrzenno czasowa, analiza percepcji internetowej produktów biobójczych w Polsce oraz innych krajach Europy – projekt naukowy o który zabiegamy
Wprowadzenie: Proponujemy nową metodę obliczeniową nasłuchiwania mediów w celu monitorowania stosowania substancji przeciwdrobnoustrojowych i ich percepcji w perspektywie jednego zdrowia. Badania wypełnią ważną lukę poprzez badanie i integrację czterech głównych pytań badawczych 1) dotyczących przestrzenno-czasowych trajektorii zainteresowania poszczególnymi grupami środków biobójczych stosowanych w rolnictwie z podziałem na agrofagi przeciw którym są stosowane bądź są znajdowane: bakterie, wirusy, chwasty, szkodniki 2) zainteresowanych interesariuszy, postaw wobec substancji biobójczych w perspektywie jednego zdrowia, 3) zgodności predykcyjnej w porównaniu z dotychczasowym nadzorem zużycia oraz biomonitoringu w roślinach i żywności/paszy 4) komunikacji i świadomości w tym kontekście.
Dane: W celu weryfikacji stosowalności nowego narzędzia przeprowadzono pilotaż.
W tym celu przeszukano niemiecki i polski Internet z wykorzystaniem narzędzia EventRegistry na występowanie fraz ‘środki przeciwdrobnoustrojowe’ wraz z ‘rolnictwo’ oraz ich wariacji od 2014 do 2022.
Dodatkowo przeprowadzono analizę polskiego, słowackiego, węgierskiego, bułgarskiego i rumuńskiego Internetu na obecność fraz ‘pestycydy’ wraz z ‘zboże’ oraz ich wariacji od maja 2022 do kwietnia 2023 przy użyciu Brand24.
Wyniki: Już wstępne wyniki pilotażu zapewniają wgląd w dynamikę zainteresowania substancjami przeciwdrobnoustrojowym i hierarchię społecznej percepcji zagrożeń, wpływ profilów psychosocjologicznych, socjolingwistycznych i kulturowych oraz znaczenie czynników społeczno-gospodarczych.
Największą różnicę między Polską a Niemcami zaobserwowano w roku 2018, kiedy temat glifosatu o ponad rząd wielkości był słabiej dyskutowany w naszym kraj.
Zainteresowanie pestycydami w kwietniu 2023 propagowało od dużego zainteresowania w infosferze słowackiej i węgierskiej 11-13. Po czym temat uzyskał szybko bardzo duże zasięgi w Polsce 14.04, żeby zapikować W Rumunii i Bułgarii 18-19.04.
Wnioski: Projekt będzie korzystać z najnowocześniejszych metod uczenia maszynowego do analizy danych zebranych z polskich i europejskich mediów internetowych.
Od ujawnienia informacji o rzekomym skażenia mięsa drobiowego wirusem A/H5N1 w dniu 28.06 na wysokim szczeblu działania Inspekcji Weterynaryjnej w końcu ruszyły pełną parą, bo dotyka bardzo ważnej dla gospodarki branży drobiarskiej, i włączono „centralne sterowanie” (na pewno dobrze z punktu widzenia informacyjnego, ale może nie epidemiologicznego).
W związku z ryzkami infodemicznymi warto monitorować obieg informacji w kontekście sytuacji związanej z grypą ptaków H5N1. Obecna wiedza naukowa, wspierana przez badania prowadzone przez Państwowy Instytut Weterynarii oraz analizy epizootyczne, nie pozwala na jednoznaczne powiązanie grypy ptaków H5N1 u kotów domowych z konkretnym źródłem (choć pewne podejrzenia są weryfikowane). Nie oznacza to że pewni interesariusze systemu mogą wprowadzać wrzutki clickbaitowe sugerujące co innego.
„Ptasia Grypa w mięsnym” Pierwsza strona – Gazeta Wyborcza z 04.07
Chcielibyśmy zauważyć i taki scenariusz przewidzieliśmy już 2.07.
“Wydaje się wielce prawdopodobne, gdy w przypadku doniesień o zachorowaniach u ludzie w kontakcie z padłymi kotami lub z zakażonym mięsem (nie muszą one być prawdziwe) to taka dez/mal-informacja (https://t.co/x6HLdCYkyS) bardzo szybko się rozprzestrzeni. W związku z narracją antyrządową (przeciw instytucjom IW i PIS) najprawdopodobniej opozycja podchwyci temat i będzie go wykorzystywać w kampanii wyborczej.“
Należy podkreślić, że autorka artykułu z Wyborczej co do zasady napisała (po korekcie – w wersji cyfrowej) prawdę (czyli nie jest to klasyczna mis/dez- informacja w wersji cyfrowej po korekcie tytułu – który w wersji drukowanej można uznać za dezinformację), ale w wyniki celowej nadinterpretacji (brak analizy niepewności pomiaru na obecność patogenów w mięsie) ma w czytelniku wywołać panikę.
Zabieg jednak się nie udał, gdyż lepsze zasięgi miało oświadczenie o nadinterpretacji niż sama wrzutka dez (mal)-informacyjna Gazety Wyborczej.
Przebieg zainteresowania frazami koty/kotów w mediach tradycyjnych i społecznościowych (zasięg i liczebność wzmianek dziennie)
Naszym zdaniem stało się tak dlatego, że aktywa zewnętrzne) się nie włączyły (w przeciwieństwie do przebiegu narracji o “zatrutym zbożu”), gdyż wciąż nie został spełniony warunek wyjściowy – czyli podejrzenie o zakażenie człowieka (do mięsa lub z kontaktu z kotami).
Między piątkiem 26.06, kiedy potwierdzono (oficjalnie) obecność materiału genetycznego wirusa H5N1, a 01.07 nie stwierdzono wzrostu zainteresowania tematem.
Przebieg zainteresowania frazami koty/kotów w mediach tradycyjnych i społecznościowych (zasięg i liczebność wzmianek dziennie)
Brak jest dyskusji o ogniskach upadków (czyli powiązanych epidemiologicznie przypadkach), co nawet mimo braku wiedzy o dochodzeniach epizootycznych świadczy raczej o braku znaczenia transmisyjności kot-kot zakażeń. Również kliniki weterynaryjne rzadziej informują o nowych upadkach (czy przypadkach chorób) o charakterystycznych objawach utożsamianych z “tajemniczą chorobą kotów”.
Dodatkowo potwierdzenie obecności materiału genetycznego wirusa H5N1 u padłych kotów bardzo zaniepokoiło branżę drobiarską, ale poza niewielkim wzrostem w popycie i podaży informacji o “ptasiej grypie”, potrzeby informacyjne nie udzieliły się populacji ogólnej.
Porównanie liczności zapytań w Google między występowania słowa „kotów” a tematem grypy ptaków
Mimo braku wzrostu zapadalności oraz wykluczeniu związku z obecnie krążącymi w dzikim ptactwie (tzn. u mew) w Polsce wariantami (przynajmniej w przypadku genomu izolatu z kota padłego 21.06 w Gdańsku EPI_ISL_17949824) wciąż dyskusje w środowisku opiekunów kotów są gorące.
Pojawia się często wątek “zatrutego zboża z Ukrainy” w paszy (http://interdisciplinary-research.eu/czy-zatrute-zboze-to-wrzutka-kremla), które to miałoby zatruwać drób, które to mięso miałoby być toksyczne dla kotów. Powszechny jest brak zaufania do instytucji państwa (ataki na Inspekcję Weterynaryjną i Państwową Inspekcję Sanitarną).
Po zastosowaniu skal Grunow-Finke (11/60) i indeksu rolniczego (1,5/10) (https://zenodo.org/record/8081493) wychodzi, że wprowadzenie intencjonalne zakażeń wirusem A/H5N1 do populacji polskich kotów było bardzo mało prawdopodobne.
Również wiemy z analiz medialnych prowadzonych od wybuchu pełnoskalowej wojny na Ukrainie, iż tematy weterynaryjne mogą polaryzować grupy interesu (ale nie ogólną populację) i obcym służbom może się nie opłacać manipulować opinią publiczną w niszowym temacie (korzyści osiągalne tylko do poziomu taktycznego).
Również bieżąca analiza dyskursu “pomoru kotów” nie wskazuje na udział zewnętrznego oddziaływania (przeciwnie niż w przypadku tzw. “zatrutego zboża”).
Załóżmy jednak, że kwestia upadków kotów jest monitorowana przez wywiad białoruski lub rosyjski (przyjemniej cieszą nas pogłoski, że tzw. „farma trolli Prigożyna” została rozwiązana).
Wydaje się wielce prawdopodobne, gdy w przypadku doniesień o zachorowaniach u ludzie w kontakcie z padłymi kotami lub z zakażonym mięsem (nie muszą one być prawdziwe) to taka dez/mal-informacja (https://t.co/x6HLdCYkyS) bardzo szybko się rozprzestrzeni. W związku z narracją antyrządową (przeciw instytucjom IW i PIS) najprawdopodobniej opozycja podchwyci temat i będzie go wykorzystywać w kampanii wyborczej. W takiej sytuacji być mogą zostaną uruchomione zagraniczne aktywa w Polsce (niekoniecznie prokremlowskie) wraz z ośrodkami zewnętrznymi oddziaływania. Możemy wtedy obserwować podsycanie pewnych tematów (media tradycyjne i społecznościowe) i uwidacznianie pewnych kont (media społecznościowe) jak również inne konta i tematy (np. nakłaniające do rozwagi) mogą być uciszane.
Czy wraz z potencjalnym ryzykiem epizootycznym pomoru kotów (wciąż trudna do określenia sytuacja) mamy do czynienia z infodemią?
[Sytuacja z wieczora 26.06]
Wytyczne i aktualne podejrzenia IW (z 26.06) są dostępne i nie będą przez nas analizowany wymiar realny epizoocji.
Do około 18.06 mieliśmy dyskusję lokalną w Gdańsku (przynajmniej jej ślady z Facebooka zachowały się) oraz zainteresowanie w środowisku lekarzy weterynarii (forum zamknięte).
W dniu 19.06 sprawa nabrała tempa (podobno wyciek z forum weterynarzy) oraz wymiaru ogólnopolskiego (media specjalistyczne i lokalne pomorskie nagłośniły sytuację).
20-21.06 jak już dyskusje w środowisku profesjonalistów oraz w mediach pomorskich stają się głośnie, to PWLW z Gdańska i GLW z Warszawy wydają komunikaty i informują opinię publiczną o dochodzeniu epizootycznym.
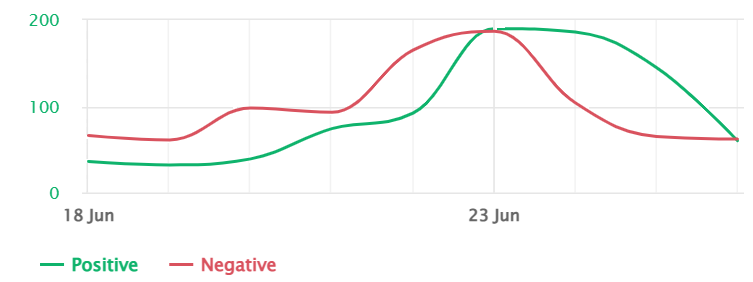
Przebieg zainteresowania frazami koty/kotów w mediach tradycyjnych i społecznościowych (zasięg i liczebność wzmianek dziennie)
Pik zasięgów sprawa pomoru kotów osiąga 22.06, a szczyt dyskusji 23.06.
Przebieg zainteresowania frazami koty/kotów w mediach tradycyjnych i społecznościowych (nacechowanie emocjolane wzmianek dziennie)
Można nawet zauważyć “panikarski” ton wzmianek z piątku 23.06 (clickbaitowe tytuły jak „tajemnicza choroba kotów” mediów wysoko-zasięgowych).
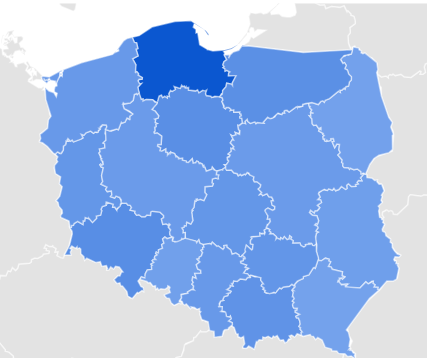
Geografia zapytań: pomór kotów w Google
Mamy koncentrację zainteresowania informacją (popytowo) na Pomorzu, kolejne województwa to Kujawsko-Pomorskie, Warmińsko-Mazurskie i Dolnośląskie.
Zainteresowanie (popyt na informację) oraz podaż (produkcja wzmianek) raczej dotyczy dużych miast (Gdańsk, Bydgoszcz, Wrocław, Kraków) na podstawie analizy słów kluczowych.
22/23.06 pikują media tradycyjne oraz 23.06 Twitter.
21-26.06 utrzymuje się stałe duże zainteresowanie na Facebooku/Instagramie.
Póki co (do 26.06) sprawa jednak głównie rezonuje w środowisku koniarzy i weterynaryjnym (duże zasięgi, ale wciąż dyskusja nie przedostaje się do populacji ogólnej).
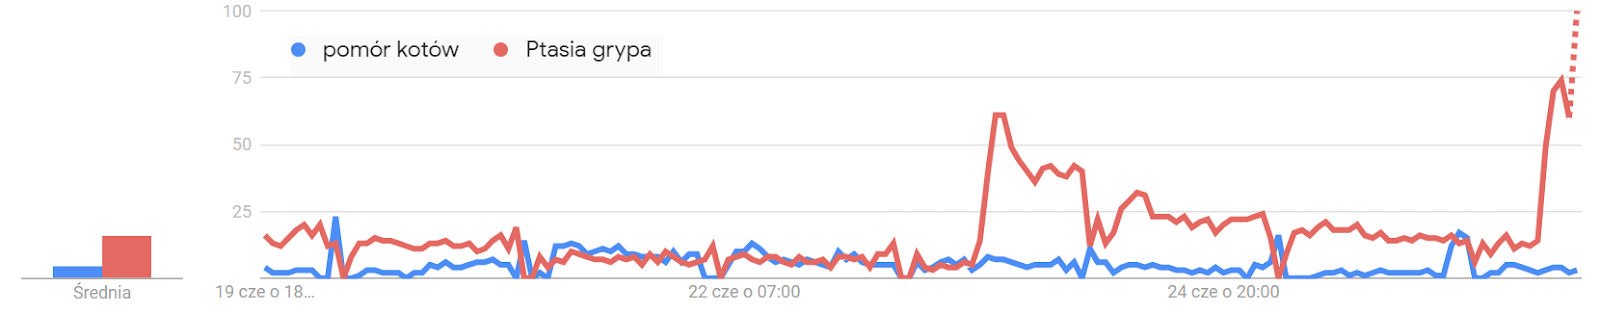
Po potwierdzeniu powiązania epidemiologicznego padłych kotów z grypą ptaków (popołudnie 26.06) doszło do wymiany słów kluczowych dotyczących z pomoru kotów (niszowego) do ptasiej grypy (głównonurtowego, bo związanego z masową produkcją drobiu, czy czynnikami zoonotycznymi).
Porównanie liczności zapytań w Google między pomorem kotów a ptasią grypą
Wraz z perkolacją do populacji ogólnej pojawiają się (26.06) teorie spiskowe (np. z Simsonów) oraz wzrasta nasycenie mis(dez)-informacją (np. nawiązania do zboża z Ukrainy, szczepionek przeciw COVID-19 czy mutacji SARS-CoV-2). 26.06 pomór kotów/ptasia grypa propaguje na Telegram i TikToka.
Od tej pory temat nabiera już międzynarodowego wymiaru (szybkie zgłoszenia o przypadkach grypy A/H5N1 u kotów do Flutracker, Promedmail, WOAH, itp.) oraz sprawą interesują się media o zasięgach światowych.
Podał Iwan Fedorow mer Melitopola na Telegramie około godziny 13 czasu polskiego w dniu 25.04.2023. Poinformował również, że rosyjski pododdział trafił na kwarantannę.
Przede wszystkim nie ma nigdzie indziej (poranek 26.04) potwierdzenia tego zdarzenia, choć postawił ten wpis służby CBRN od Australii po USA na nogi.
Tu nie będziemy rozważać nad biologicznymi procesami związanymi z występowaniem sporów wąglika na Ukrainie i zajmiemy się tylko warstwą informacyjną tzw. biopolityczną i infodemiologiczą w ostatnich dniach (25-26.04 plus dla porównania wcześniejsze okresy). Również nie będziemy analizować, na ile takie zdarzenie jest prawdopodobne z biologicznego punktu widzenia – interesuje nas jedynie aspekt propagacji informacji.
Około godziny 16 czasu polskiego w dniu 25.04 PAP zredagowała i wypuściła notkę prasową po rosyjsku i polsku na ten temat, co bardzo szybko podchwyciły polskie media.
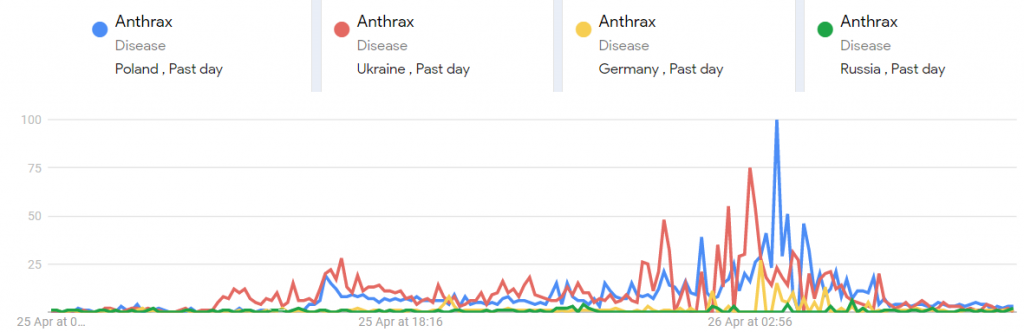
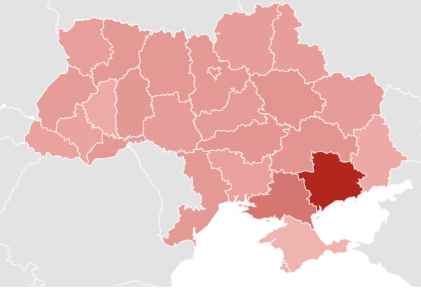
Zainteresowanie Wąglikiem w wyszukiwarce Google w różnych krajach
25.04 wieczorem post Fedorowa miał około 100 tyś. wyświetleń, a 26.04 rano 180 tyś. Co świadczy o dużym zainteresowaniem w nocy 25/26.04 i brakiem podjęcia tematu rano 26.04.
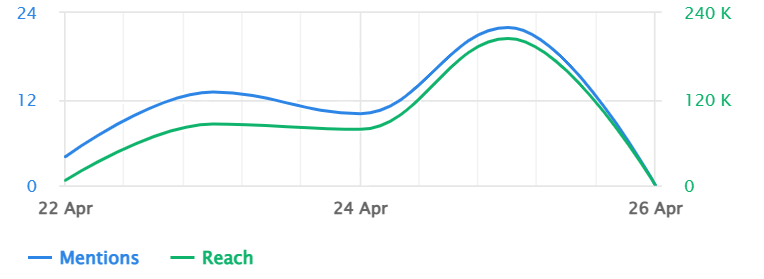
Zainteresowanie Wąglikiem w języku polskim (wzmianki w mediach społecznościowych i tradycyjnych) przy użyciu Brand24
Widzimy kilka tysięcy razy większe zainteresowanie popytowe wąglikiem (liczone zapytaniami w Google) oraz podażowe (liczone w zasięgach wzmianek na ten temat) do średniej w Polsce i Ukrainie.
Zainteresowanie Wąglikiem w wyszukiwarce Google w różnych obwodach Ukrainy
Nie widać za to ruchu na rosyjskim Telegramie i innych mediach społecznościowych (jedynie 2-krotny wzrost liczby postów głównie cytujących źródła ukraińskie), ani wyszukiwań w Yandex. Należy to jednak z pewną dozą niepewności interpretować, bo media rosyjskie są w dużej mierze kontrolowane i inwigilowane przez służby. Ponadto wąglik jest endemiczny w Rosji, a rosyjskie społeczeństwo jest mocno zmilitaryzowane w tym sensie, że dyskusje o CBRN są tam na porządku dziennym. Ponadto analizując wcześniej rosyjskie media udało się wskazać przebieg i charakterystykę oddziaływania na społeczeństwo w obszarze problematyki bioterroryzmu i szerzej negacjonizmu biologicznego w czasie wojny.
Zainteresowanie Wąglikiem w języku rosyjskim (wzmianki w mediach społecznościowych i tradycyjnych) przy użyciu Brand24
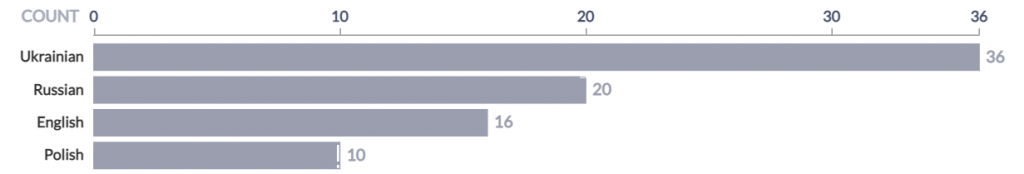
Dyskurs w mediach tradycyjnych jest zdominowany przez media ukraińskie (w obu używanych językach), międzynarodową prasę branżową anglojęzyczną, oraz polską „bulwarową”.
Zliczenia artykułów prasowych dotyczących wąglika w głównych językach (eventregistry)
Póki co w Polsce nie zanotowano zainteresowania cyprofloksacyną (antybiotykiem nr 1 z wyboru, również stosowanym jako profilaktyka poekspozycyjna razem ze szczepionką BioThrax zarejestrowaną przez URPL w postaci płucnej zakażenia), ale nie zaobserwowano też rannego piku zainteresowania tematem (już 26.04) jak to zazwyczaj się dzieje (patrz kazus potencjalnego użycia gazu bojowego wobec obrońców Mariupola). Może to świadczyć o wypaleniu tematu.
Zainteresowanie cyprofloksacyną w polskich aptekach (za gdzie po lek)
Podsumowując dyskurs wysuwają się takie wnioski:
nie ma prawie nic po stronie rosyjskiej w runecie (jedynie niewielki wzrost liczby wpisów dotyczących kwarantanny i wąglika), a jakieś dyskusje by pewnie były jakby rzeczywiście kwarantannowali duże pododdziały (ale może tego nie robią żeby utrzymać gotowość bojową – patrz kazus ewakuacji kowidowej lotniskowców US Navy i Marine nationale);
głównie wzmianki (artykuły prasowe) w językach ua, ru (ale nie w mediach z Rosji), en, pl oraz główne zainteresowanie lokalnie w obwodzie Zaporoskim (raczej po prawej “wolnej” stronie Dniepru);
przypadkiem (przez położenie przyfrontowe) czy celowo Polska infosfera stała się głównym teatrem dyskusji (duże zainteresowanie populacji ogólnej);
prawdopodobnie idzie ofensywa i to byłby świetny ruch ukraińskiego INFOOPS (ale jak widać paniki nie wywołali w rosyjskiej armii, tylko w Polsce oraz w środowisku specjalistów);
w przypadku zaobserwowania wzmożonego zainteresowania tematem wąglika w Polsce (na co raczej się nie zanosi), należy szybko wprowadzić reglamentację cyprofloksacyny. Warto podkreślić, że jest to antybiotyk używany w profilaktyce poekspozycyjnej postaci płucnej, do postaci skórnej (a z tą zgodnie z opisem posta moglibyśmy mieć do czynienia) nie mamy żadnej preferowanej (i zarejestrowanej przez FDA) profilaktyki wtórnej (co nie znaczy, że nie mamy czym leczyć tylko, że decyzję indywidualnie by podejmował lekarz chorób zakaźnych z mikrobiologiem). Akurat mamy rocznicę awarii elektrowni atomowej w Czarnobylu i warto przypomnieć panikę już z obecnej wojny w 2022 i wykupowaniem jodku potasu;
warto zwrócić uwagę na działania Rosji i Ukrainy obecnie i wzmocnić czasowo bezpieczeństwo biologiczne i informacyjnie w Europie, gdyż zgodnie z przesłankami z USA, może się coś wydarzyć w tym obszarze na przełomie kwietnia i maja 2023.
Widzimy, że monitorowanie real-time Internetu w aspekcie chorób zakaźnych i bioterroryzmu jest przydatne.
Czy wzmożoną kampanię informacyjną przeciw bezpieczeństwu żywnościowemu krajów NATO i UE graniczących z Ukrainą można było wykryć i przewidzieć?
Tak po dwakroć
Przede wszystkim należy oddzielić warstwę rzeczywistego problemu polskich rolników od działań polaryzacyjnych obcej inteligencji (niekoniecznie rosyjskiej).
Prognoza
To jest ciekawa sytuacja, że pierwszy nasz tekst powstał pod koniec lata 2022 i pierwsza krótko-okresowa i predykcja już się co do niektórych punktów sprawdziła na przednówku 2023 (protest rolnicze w Polsce i granie bezpieczeństwem żywnościowym)
(Przyjęte do druku w ” Terroryzm – studia, analizy, prewencja”)
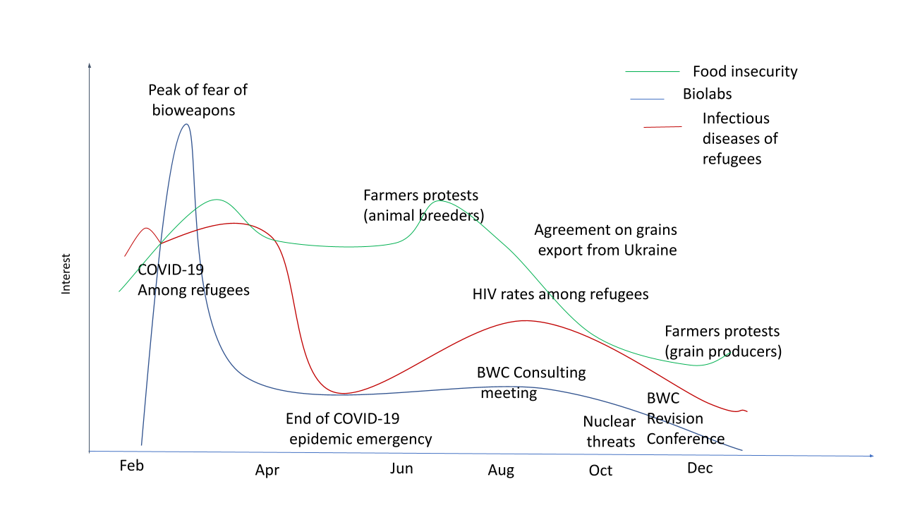
Następnie analizując polskie media udało się wskazać przebieg i charakterystykę odziaływania na polskie społeczeństwie w obszarze biologicznym od wybuchu pełnoskalowej wojny na Ukrainie.
Wzrost zainteresowania bezpieczeństwem żywnościowym na początku 2023 spowodowany prawdopodobnie przez niepowodzenie kampanii dezinformacyjnej dotyczącej biolabów i chorób zakaźnych, jak również okienkiem otwierającym się przez błędne decyzje ministrów rolnictwa regionu, głównie Polski.
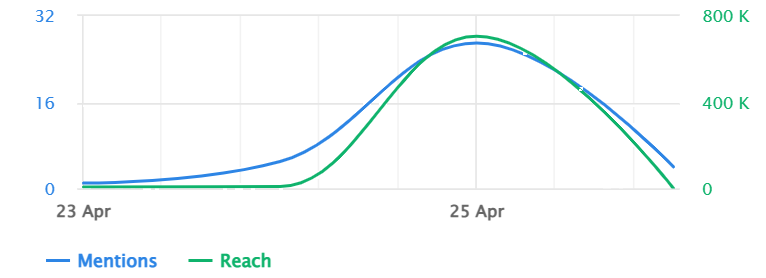
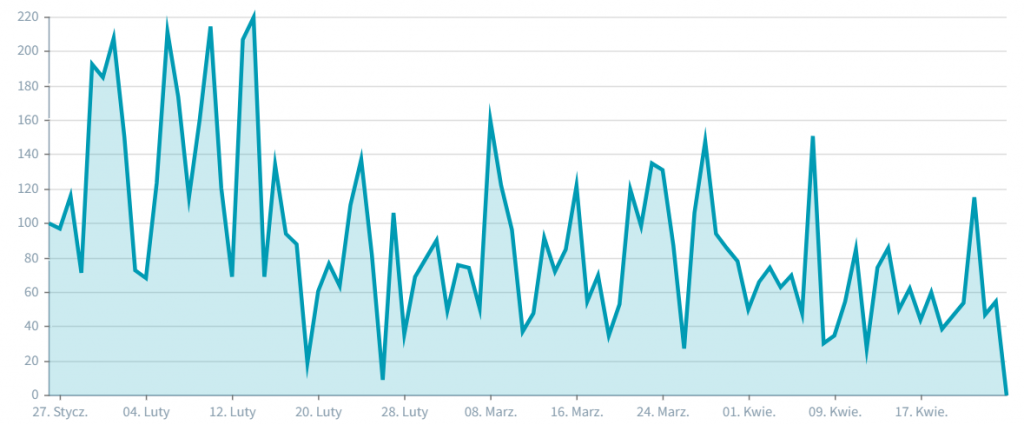
Spójrzmy „ad hoc” na przebieg zainteresowanie frazami bezpieczeństwo żywnościowe, zatrute zboże, czy pestycydy (w kontekście żywności).
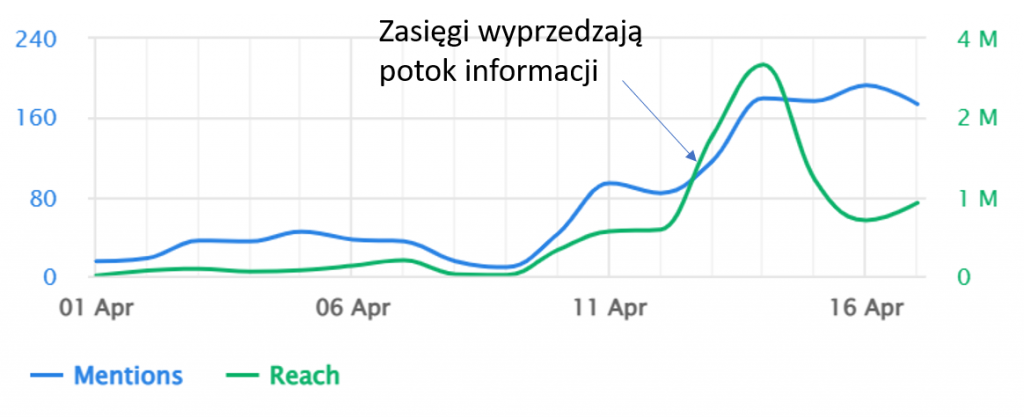
Zasięgi pikują nienaturalnie około 14.04
W związku z tym, że sytuacja gwałtownie ewoluowała i temat uzyskał bardzo duże zasięgi (które potem wróciły do poziomu wyjściowego) można podejrzewać udział botów, farm i agentów wpływu oraz innych narzędzi rezonowania w promowaniu zagrożenia.
Dziwne ruchy w polskiej infosferze zauważyli analitycy związani z kulturą bezpieczeństwa i kontrwywiadem
Przykład użytkownika zaatakowanego w tym czasie
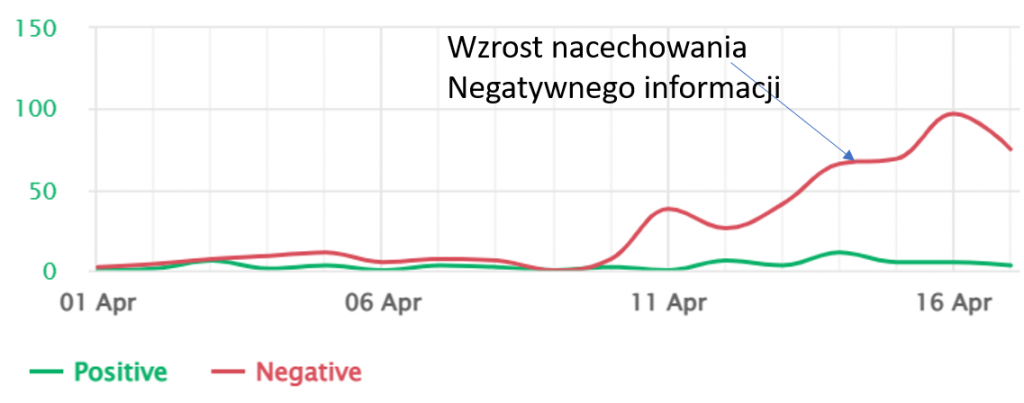
Widzimy koncentrację negatywnych emocji 14 i 16 kwietnia, czyli jeszcze przed ekspresowo procedowanym zamknięciem granic dla wielu produktów żywnościowych z Ukrainy do Polski.
silny udział emocji z kumulacją 14 i 16 kwietnia
Rozporządzenie w tej sprawie zostało opublikowane w Dzienniku Ustaw przed północą 15.04.
zakaz importu zboża itp. z Ukrainy
W związku z powyższymi analizami z dużą dozą pewności możemy stwierdzić, że problem wykorzystania emocji związanych z ryzykiem zdrowotnym związanym z importowanym zbożem był przewidywalny, a działania promujące ten dyskurs są również widoczne.
Nie można jednak jedynie rosyjskim spin-doktorom przypisywać wyłącznej sprawczości w tej kwestii. Jedynie wykorzystują już istnieje problemy i konflikty (np. związane z kampanią wyborczą). Również udziału innych sił wewnętrznych i zewnętrznych odziaływujących na infosferę w obszarze integralności biologicznej nie da się wykluczyć (np. wykupiony w agencji marketingowej usługi SEO).
Update 23.04
Krótki raport na ten temat został spisany (z pomocą dra Stanisława Maksymowicza)
Pozostałość pestycydów w zbożu byłaby objęta naszym projektem (o monitorowaniu zużycia i percepcji środków przeciwdrobnoustrojowych) i gdybyśmy mieli ten grant to można w czasie rzeczywistym moglibyśmy analizować badane zjawisko.


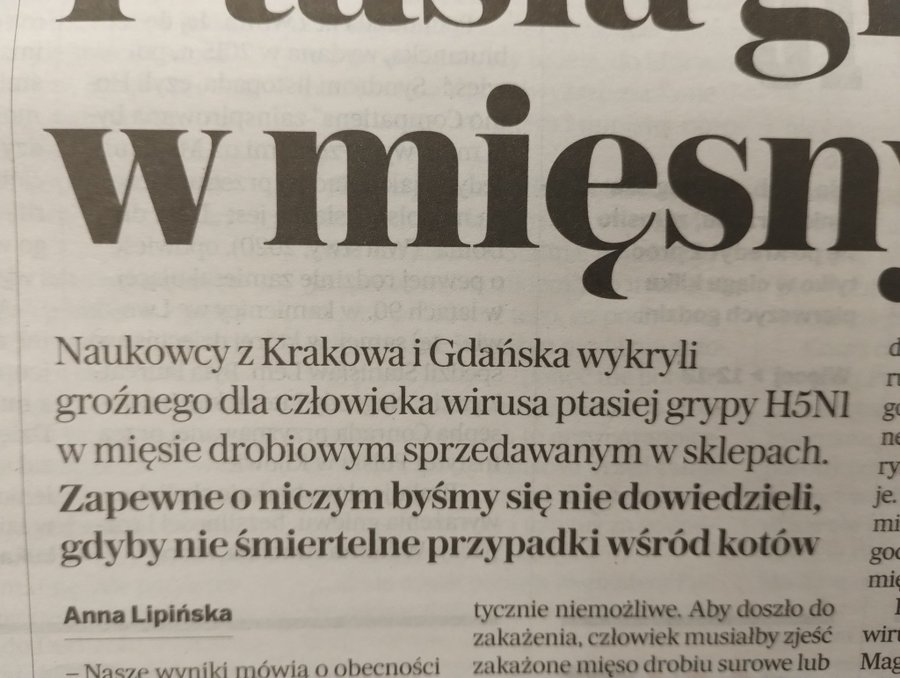 „Ptasia Grypa w mięsnym” Pierwsza strona – Gazeta Wyborcza z 04.07