Understanding socio-epidemiological background of infection disease dynamics is an extremely difficult task and this problem was professionally approached in a paper published in several Lancetlatest papers [1–3]. However, some concerns in interpretation and limitation need additional discussion. As authors used fit-all-size methodology, they could lose precision due to heterogeneity of given regions. Thus, estimated variation in the COVID-19 outcomes in geography on global scale could be far from reality on local scale.
Many scientists attempt to reveal the “epidemiological mystery” of COVID-19: why the coronavirus hit some regions so much harder than others and how it corresponds with measurable epidemiological indexes. This and a few other modelling and epidemiological paradoxes (in which different regions are compared on populational level) such as effectiveness of pharmaceutical intervention (e.g. vaccination) or NPI (e.g. lockdowns) need to be carefully assessed if they are interpreted correctly according to epidemiological knowledge. Unfortunately, even with a correct statistical model (without understanding underlying socio-epidemiological variables), by comparing incidences in different regions one could easily underestimate effectiveness of NPI [4] or vaccination [5] (even unintentionally) or it could also lead to manipulation (for instance one could pick up only these indexes, which support a given thesis).
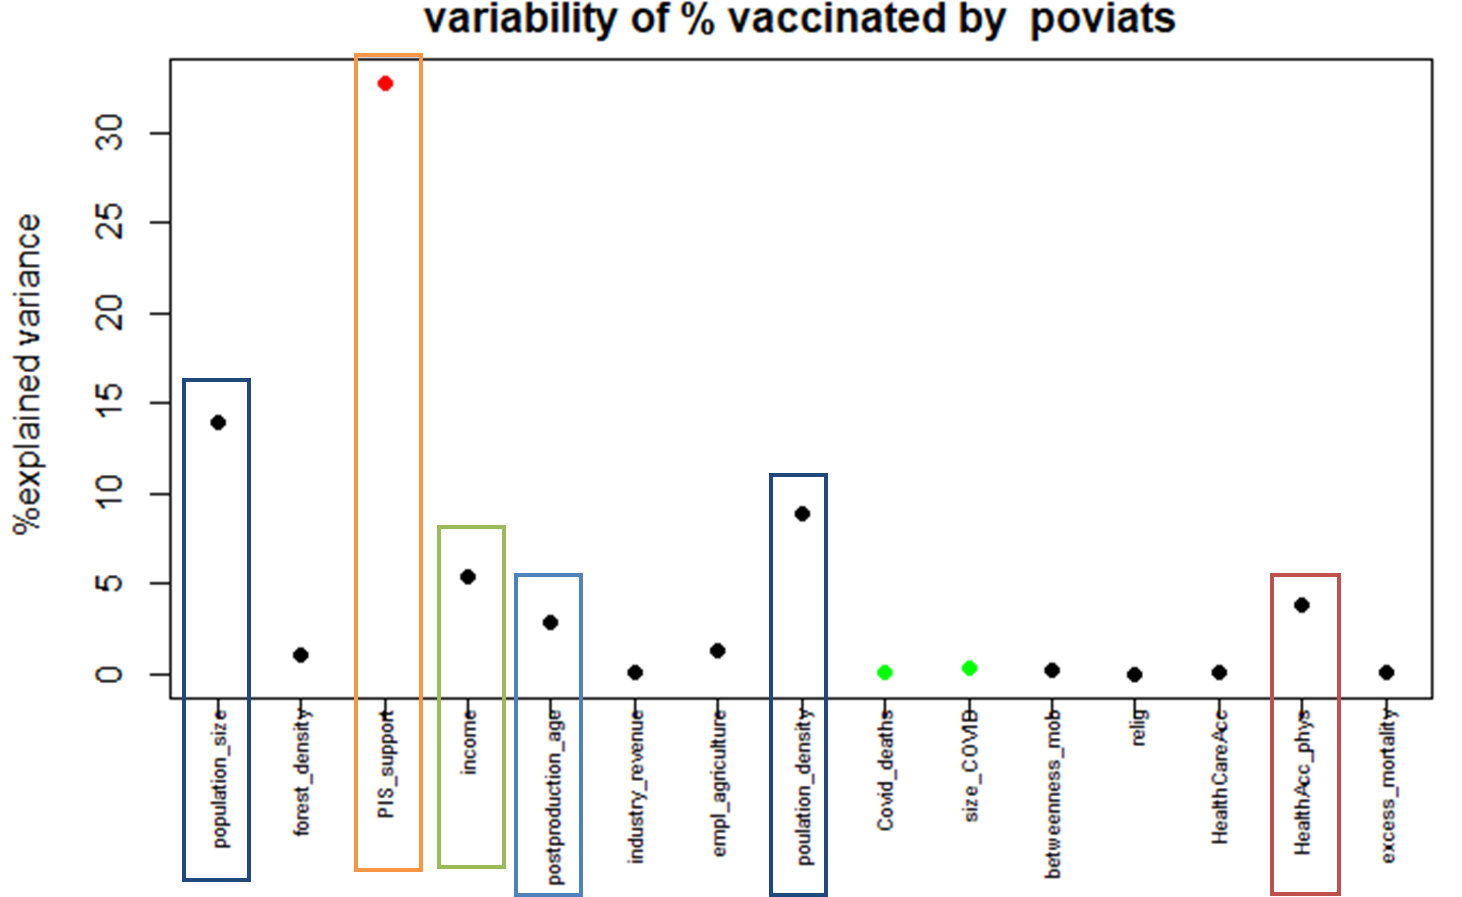
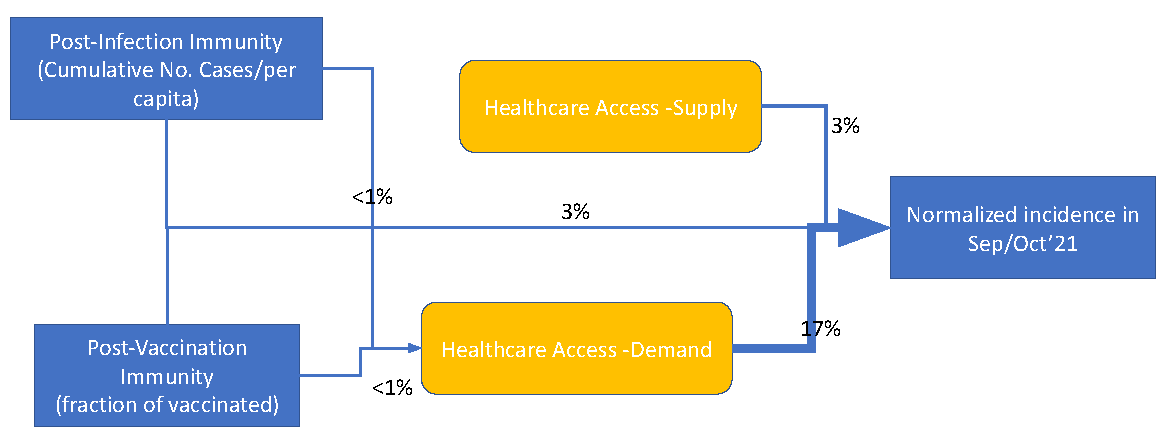
Let us look closer into post-communistic, Slavic majority Eastern Europe countries as an example, because their public health systems, political transformations, alternative social capitals and second demographic transitions have similar patterns [6]. The red light should turn on, if we compare reported case notifications [7] with infection standardised estimates (in brackets [1]) per 1000 inhabitants for the same time period for Slovakia 147 (166), Poland 76 (469) and Russia 50 (1165). Thus, cumulative cases till the end of the so-called European 3rd wave (so called “dark figure”) were estimated to be from 1.13 in Slovakia to 23.3 in Russia fold greater than the confirmed cases. Even reminding that Slovakia performed all country cross-sectional studies on COVID-19 prevalence and Russia has been known since the HIV epidemic [8] to manipulate infection registries, such a difference is rather impossible to be true. Moreover, death toll (if no vaccination is applied) based on crude death registry as well as exceed death estimation (in bracket) per 1000 inhabitants for the first year of vaccination roll out were calculated [3] for Poland 7.9 (9.0), Russia 5.2 (12.8), Czechia 9.9 (10.0). Thus, the corrected death tolls using exceed death were estimated from 1.01 in Czechia to 2.46 in Russia fold greater than the crude deaths. One more time, death registries in Russia are known to be flawed [9] and on the other hand the Czech mortality registry is working relatively well [10], but again such a variation is extremely unlikely. This could lead to the conclusion that even a well performing estimation method on a global scale may be really poor in some particular regions. I guess that possibly Healthcare Access (sensu lato with affective and behavioural components [11]), which was found not to be associated with epidemiological outcomes [1] should be revisited.
Therefore, published models have a great advantage of modelling from a global perspective, but on the other hand, due limitations raised here, together with those already indicated by authors [1–3], more emphasis should be given on regional research, especially on intra-country variability.
References
1. Bollyky TJ, Hulland EN, Barber RM, Collins JK, Kiernan S, Moses M, et al. Pandemic preparedness and COVID-19: an exploratory analysis of infection and fatality rates, and contextual factors associated with preparedness in 177 countries, from Jan 1, 2020, to Sept 30, 2021. The Lancet. 2022 Feb;S0140673622001726.
2. Barber RM, Sorensen RJD, Pigott DM, Bisignano C, Carter A, Amlag JO, et al. Estimating global, regional, and national daily and cumulative infections with SARS-CoV-2 through Nov 14, 2021: a statistical analysis. The Lancet. 2022 Jun;399(10344):2351–80.
3. Watson OJ, Barnsley G, Toor J, Hogan AB, Winskill P, Ghani AC. Global impact of the first year of COVID-19 vaccination: a mathematical modelling study. Lancet Infect Dis. 2022 Jun;S1473309922003206.
4. Herby J, Jonung L, Hanke SH. A Literature Review and Meta-Analysis of the Effects of Lockdowns on COVID-19 Mortality [Internet]. Available from: https://sites.krieger.jhu.edu/iae/files/2022/01/A-Literature-Review-and-Meta-Analysis-of-the-Effects-of-Lockdowns-on-COVID-19-Mortality.pdf
5. Subramanian SV, Kumar A. Increases in COVID-19 are unrelated to levels of vaccination across 68 countries and 2947 counties in the United States. Eur J Epidemiol,2021 Dec;36(12):1237-40. https://link.springer.com/10.1007/s10654-021-00808-7
6. Jarynowski A. Phenomenon of participatory “guerilla” epidemiology in post-communist European countries. Balt Rim Econ. 2021;3:25–6. https://sites.utu.fi/bre/phenomenon-of-participatory-guerilla-epidemiology-in-post-communist-european-countries/
7. Our World in data. Coronavirus (COVID-19) Cases [Internet]. 2022. Available from: https://ourworldindata.org/covid-cases
8. Rechel B. HIV/AIDS in the Countries of the Former Soviet Union: Societal and Attitudinal Challenges. Cent Eur J Public Health. 2010 Jun 1;18(2):110–5.
9. Danilova I, Shkolnikov VM, Jdanov DA, Meslé F, Vallin J. Identifying potential differences in cause-of-death coding practices across Russian regions. Popul Health Metr. 2016 Dec;14(1):8.
10. Kossarova L, Holland W, Mossialos E. ‘Avoidable’ mortality: a measure of health system performance in the Czech Republic and Slovakia between 1971 and 2008. Health Policy Plan. 2013 Aug 1;28(5):508–25.
11. Jarynowski A, Belik V. Access to healthcare as an important moderating variable for understanding geography of immunity levels for COVID-19 – preliminary insights from Poland [Internet]. Available from: http://medrxiv.org/lookup/doi/10.1101/2021.12.08.21267167 (accepted to EJTCM)

 Access to healthcare as an important moderating variable for understanding geography of immunity levels for COVID-19 – preliminary insights from Poland
