Problem: W związku rozprzestrzenianiem się zakażeń wirusem SARS CoV-2 i choroby COVID-2019 istnieje potrzeba analizy percepcji problemu w Polsce w celu przygotowania szczególnych rozwiązań, umożliwiających podejmowanie działań minimalizujących zagrożenie dla zdrowia publicznego. Więcej z SARS-CoV-2 paniki niż rzeczywistego pandemicznego ryzyka, ale przy dysfunkcjonalnej polskiej służbie zdrowia (brak kadr i dostępności do szybkich testów itp.), wirus może trafić na podatny grunt, zwłaszcza że 04.03.2020 potwierdzono pierwszy przypadek wirusa w Polsce.
Metodologia: Naszym zadaniem jest badanie percepcji wirusa w polskim społeczeństwie za pomocą analizy ilościowej śladu cyfrowego w Internecie (Twitter, Google, Youtube, Wikipedia i media elektroniczne reprezentowane przez Event Registry) od pojawienia się pierwszych informacji w styczniu 2020 do 03.03.2020. Wykorzystano proste techniki dataminingowe, przetwarzania języka naturalnego czy analizy danych społecznościowych. Każda badana platforma internetowa została poddana analizie reprezentatywności oraz składu grupy docelowej.
Wyniki: Zainteresowanie wirusem ma charakter falowy i posiada informacyjne fazy “chińską” i “włoską” na wszystkich platformach oraz fazę komentatorską na mediach społecznościowych dotyczącą specustawy. W mediach społecznościowych duże znaczenie mają pojęcia i zagadnienie zagrożenia, strachu i prewencji. Sieci Twittera odzwierciedlają polską scenę i podziały polityczne. Zidentyfikowano potencjalne źródła dezinformacji oraz zaprezentowano głównych aktorów i influencerów.
Wnioski: Media tradycyjnie i społecznościowe nie tylko odzwierciedlają rzeczywistość, ale ją też tworzą. Polskie władze mogły by, posiadając rzetelną analizę percepcji problemu, przygotować się i zarządzać społecznym wymiarem epidemii w sposób optymalny. Ze względu na zaobserwowanie baniek informacyjnych (np. na Twitterze), publiczne kampanie informacyjne mogą mieć mniejszy wpływ na społeczeństwo niż oczekiwano. W celu większej penetracji, być może należy bardziej dywersyfikować kanały informacyjne, by dotrzeć do jak największej liczby ludzi. Premier i wojewodowie, korzystając z uprawnień wynikających z procedowanej specustawy o zwalczaniu COVID-2010, mogą nakazać blokowanie kont i treści szerzących dezinformację oraz podejrzewanych o bycie agentami wpływu wywiadów zagranicznych.
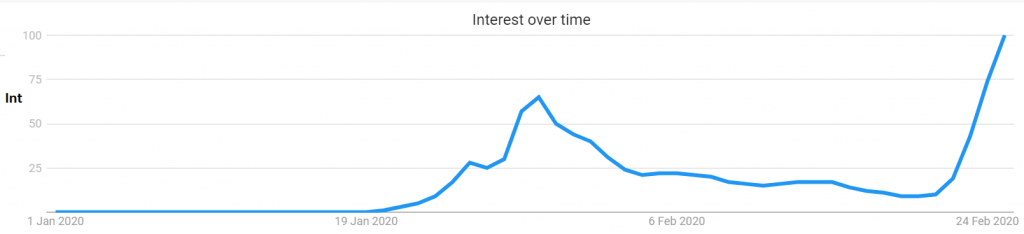
Zainteresowanie Koronawirusem z Wuhan można mierzyć (jak w tym przypadku opracowanym wspólnie z Vitaly Belik ).
Można wyróżnić 2 fazy zainteresowania – z końca stycznia (kiedy w Chinach ogłoszono i potwierdzono epidemię) oraz z końca lutego (kiedy we Włoszech wzrosła liczba zakażeń).
Zapytania w Google „Koronawirus” w Polsce
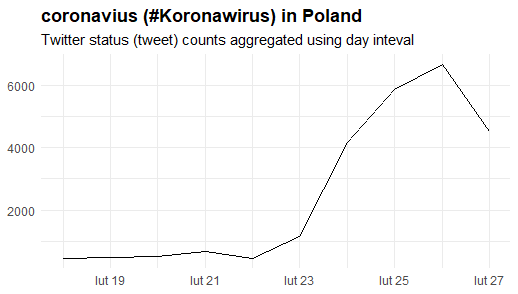
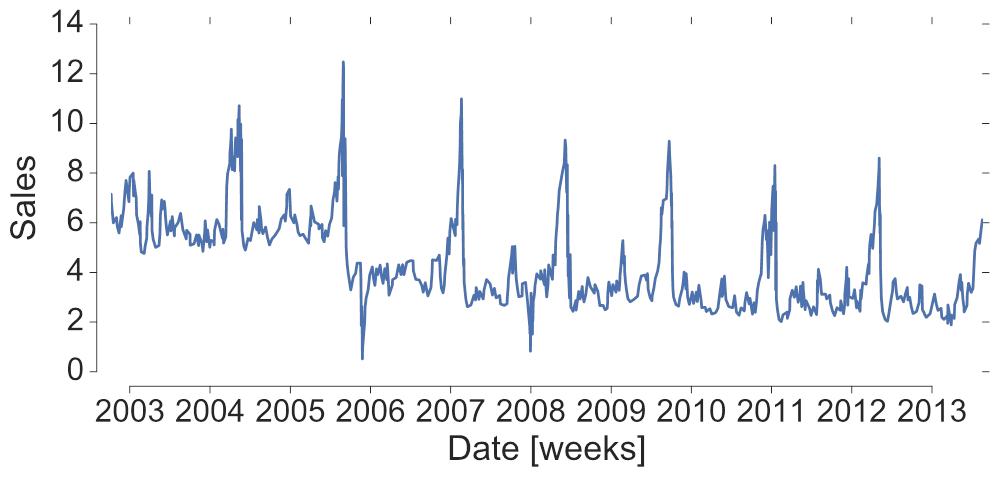
Zainteresowanie widać również na Twitterze.
Zliczenie Twittów dziennie z #Koronawirus w Polsce
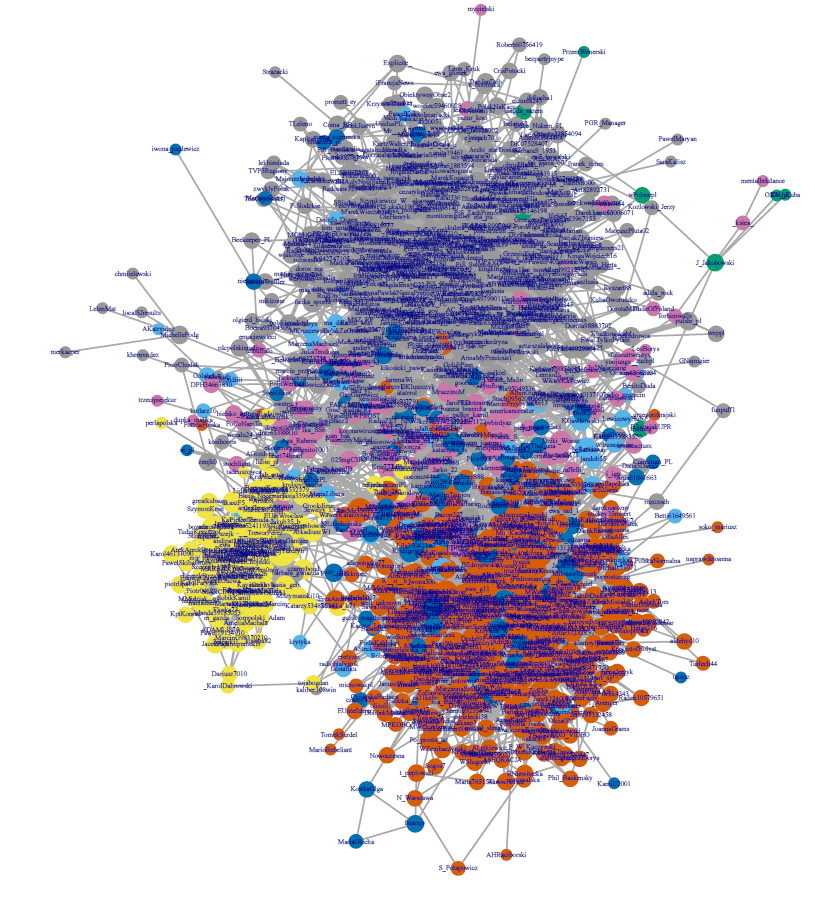
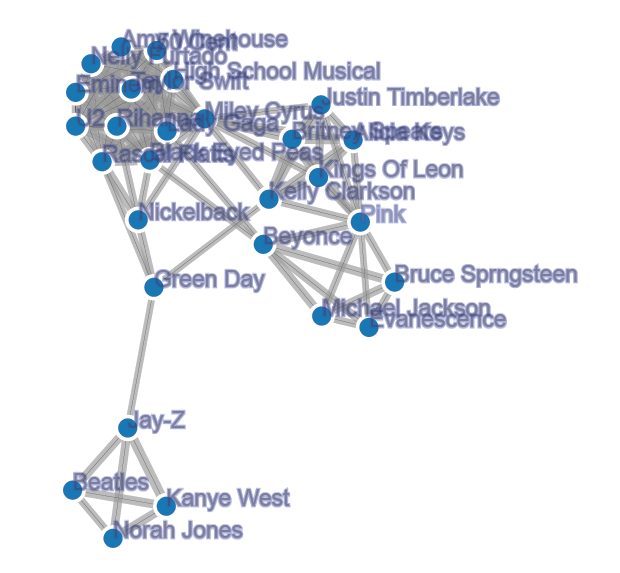
Sieć retweetów pokazuje jak dyskurs jest podzielony na obóz rządzący, opozycję i sektę religijno-polityczną Chojeckiego. W tej sieci pokazano tylko konta, które wygenerowało przynajmniej 3 tweety.
Sieć retwittów z #Koronawirus. Kolor szary – obóz rządzący, kolor pomańczowy – opozycja, żółty – sekta Chojeckiego
Plik sieci w grafice wektorowej (jakby ktoś chciał wyszukać konta).
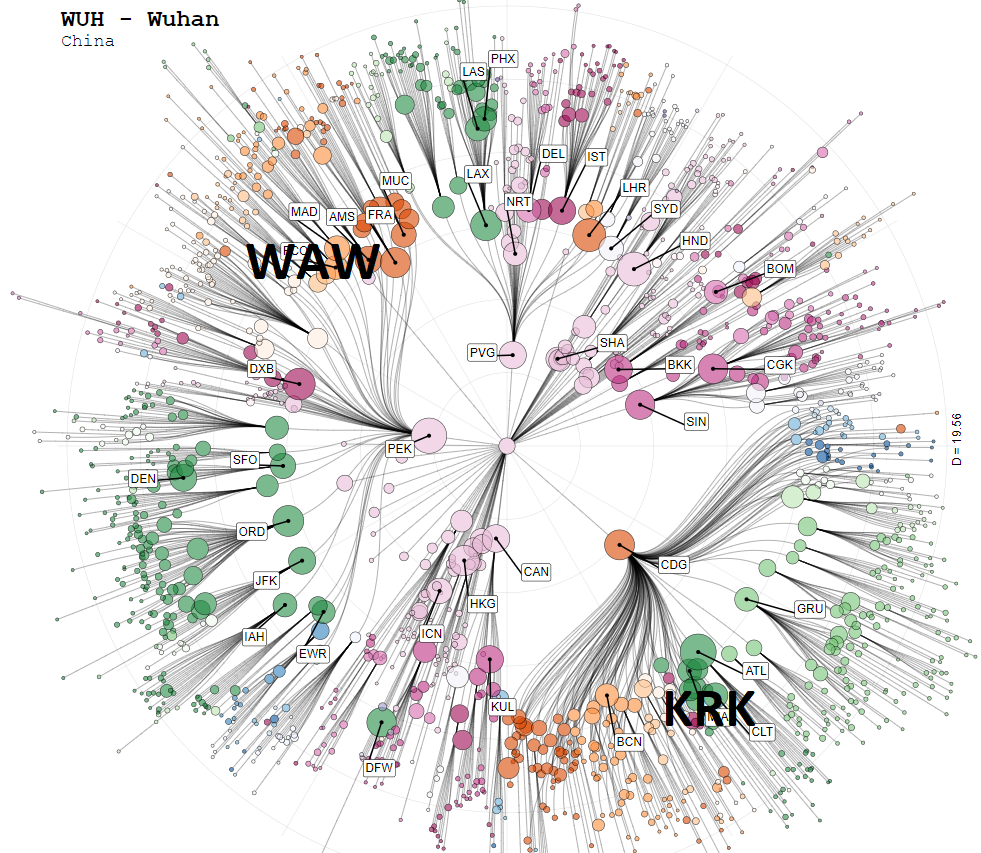
Polska to peryferia. Jednakże ciekawe, że WAW jest niżej niż KRK w analizie ryzyka ze względu na usieciowanie ze źródłem w Wuhan. Wynika z tego, pewnie prędzej będziemy mieli introdukcje droga lądową lub przez lotniska regionalne niż przez lotnisko im. Chopina.
Kwestia szacowania rzeczywistej liczby zakażeń jest popularnym zagadnieniem wśród specjalistów, zwłaszcza że wirus z Wuhan ma ogromny potencjał medialny. Przede wszystkim główne charakterystyki epidemiologiczne wirusa jak jego współczynnik zaraźliwość (prawdopodobieństwo zakażenia na kontakt) i jej czas trwania nie są znane. Wiemy, że czas inkubacji trwa kilka do kilkunastu dni, a śmiertelność wynosi ok 3% (w większości w obciążonej np. starszej populacji). Dodatkowo sprawozdawczość z ChRL jest politycznie obciążona (np. przez wpływ na handel zagraniczny). Począwszy od ogłoszenia wykrycia nowego wirusa 31.12.2019 (podobno przypadki notowano już na początku grudnia), do 25.01.2020 odnotowano niecały 1000 przypadków.
W związku z tym, że kilkadziesiąt (ok 5%) z nich odnotowano zagranicą (w tym odległych krajach jak USA czy Francja), podejrzewa się że zakażonych może być znacznie więcej. Przyjrzyjmy się więc mobilności. W Wuhan znajduje się lotnisko obsługujące populację ponad 20 mln metropolii oraz dodatkowe 30 mln prowincji. Ruch lotniczy wynosi 25 mln wyloto/osób z czego około milion to podróże zagraniczne (bezpośrednie loty to 300 tyś) rocznie. Zakładając około miesięczne okno wyjazdowe oraz że obszar zapowietrzony zamieszkały przez ok 10 mln mieszkańców generuje ponad połowę ruchu zagranicznego, otrzymamy około 100 000 podróży wyjazdowych (przy uwzględnieniu zwiększonych potoków w związku z nowym rokiem księżycowym), co stanowi 1% populacji narażonej.
Mamy więc dysproporcję między 5% zapadalności zagranicznej oraz 1% mobilności. Wynika z tego, że możliwym jest iż epidemia jest istotnie większa (5 krotnie w naszym teoretycznym przypadku). Oczywiście powyższe szacunki są bardzo „na oku” i nie uwzględniają wielu czynników. Jednak na ich podstawie warto zwrócić uwagę na możliwe niedoszacowanie oficjalnie podawanej liczby chorych.
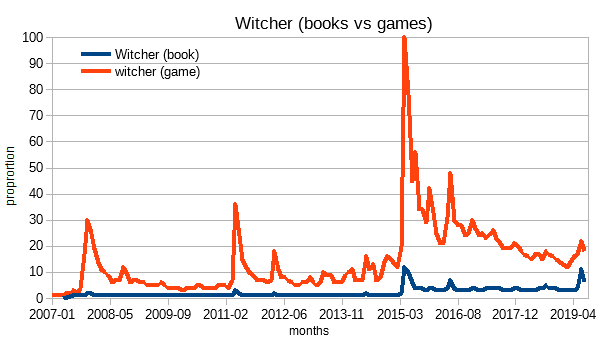
Książki Andrzeja Sapkowskiego są chwilo (na podstawie ostatnich 24h) po świętach Bożego Narodzenia najczęściej sprzedawanymi książkami na Amazon.com z powodu popularności serialu Wiedźmin (The Witcher) produkcji Netflix.
Amazon Author Rank z 30.12.2019
Należy zwrócić uwagę, że w przemyśle kreatywnym tydzień po świętach jest tygodniem o najmniejszej sprzedaży książek w roku, więc chwilowa wysoka pozycja w rankingu świadczy raczej o braku światowej konkurencji. Dodatkowo niska pozycja w nośnikach elektronicznych oznacza, że zakup książek wiąże się raczej z kolekcjonowaniem gadżetów niż chęcią zapoznania się literaturą polskiego AS-a fantasy.
Nie oznacza to, że Sapkowski nie jest niekwestionowanym liderem polskiego rynku książek z kilkoma milionami sprzedanych egzemplarzy oraz przychodów z kontaktów na produkcję gier i filmów na prawie 100 mln zł rocznie.
W związku z tym, że stwierdzono kolejne zakażania w powiecie wschowskim (secondary case) poza pierwszym przypadku (index case), bardzo prawdopodobnym jest, że ASF będzie propagował z nowego ogniska.
Zgodnie z przewidywaniami naszego modelu, najbardziej prawdopodobny czas dojścia ASF-u do świńskiego rogu w Wielkopolsce, to już tylko około 12 miesięcy.
Szacowanie czasy introdukcji ASF-u z uwzględnieniem powiatu wschowskiego (update 15.11.2019):
Szacowanie z uwzględnieniem powiatu wschowskiego (update 15.11.2019):
Niestety wszelkie starania, że by opóźnić dojście do ASF-u do świńskiego dołka są już nieaktualne. ASF został zdiagnozowany u dzika w powiecie wschowskim.
Nasze przewidywania o przeskoku sprawdziły się co do miejsca (powiat wschowski wykazywał wysoką centralność PageRank i był w wśród 15% najważniejszych powiatów dla propagacji wirusa), lecz stało się to szybciej (najbardziej prawdopodobny czas dojścia w naszym modelu to dopiero wiosna 2022).
Przypominamy nasz model (który jeszcze nie został zaktualizowany o powiat wschowski):
Sezon introdukcji (późna jesień) jest również łatwo wytłumaczalny, bo dopiero od niedawna dziki zeszły z pól kukurydzy do lasów i również w pobliże osiedli ludzkich, w związku z poszukiwaniem pożywienia.
Zajmijmy się interdyscyplinarną oceną ryzyka oraz wpływu na bezpieczeństwo Polski oraz innych krajów NATO / AUSCANNZUKUS związanego z naturalnym, bądź intencjonalnym rozprzestrzenianiem ASF (Afrykański Pomór Świń). Wirus ASF powoduje ostrą chorobę u świń domowych i dzików i chociaż nie powoduje choroby u ludzi, jego wpływ na gospodarkę, zwłaszcza poprzez handel i rolnictwo, jest znaczny. W ujęciu krajowym (ASF rozprzestrzeniania się ze wschodu na zachód Polski od 2014 roku), obecnie epizootia ASF obejmuje ok. powierzchni 30% Polski odpowiadającej za ok. 10% produkcji polskiej wieprzowiny powodując ponad 400 mln zł bezpośrednich i ponad miliard zł pośrednich rocznych strat, a do 90% hodowców ze stref zapowietrzonych rezygnuje z produkcji. W ujęciu globalnym ekspansja wirusa (ze wchodu na zachód Europu oraz przez Rosję do Chin i dalej kolejnych krajów ASEAN-u) przyczynia się do głębokich zmian w aspekcie ekonomicznym (np. spadek pogłowia świń – na Ukrainie prawie 3-krotny, ogólnoświatowe braki w zaopatrzeniu leków do produkcji których wykorzystuje się świnie), społecznym (np. masowe protesty w Europie Wschodniej) czy kulturowym (np. wieprzowina od kwietnia 2019 nie jest już najczęściej spożywanym mięsem globalnie). Według naszego modelu matematycznego Wielkopolska zostanie szacunkowo zainfekowana w niecałe 3 lata, a pojawienie ASF się w tzw. „świńskim rogu” może spowodować niepokoje społeczne na niespotykaną w III RP skalę. ASF został prawdopodobnie użyty już kilkukrotnie jako broń biologiczna przez CIA na Kubie w 1971 oraz przez Sowietów kilka lat później. Podzielmy aspekty badania na (I) analizę epidemiologiczną z akcentem na pośrednie koszty choroby potencjalnie dewastujące produkcję wieprzowiny w kontekście bezpieczeństwa żywnościowego, (II) teoretyczny model wykorzystania ASF-u jako broni biologicznej (III) oraz skutki w postaci ruchów protestu.
Pokrótce (szczegóły w analizie w języku angielskim): I) Epidemiologia. ASF charakteryzuje się dużą liczbą dróg zakażeń – z decydującą rolą antropomorficzną. W skali globalnej bioasekuracja farm i pasywny monitoring zwierząt są jedynymi kosztowo-efektywnymi środkami prewencyjnym (nie istnieje na chwilę obecną ani lekarstwo ani szczepionka na ASF). Kontrola populacyjna dzików może, a nie musi wpływać na rozprzestrzenianie się ASF. II) Agroterroryzm. Pokażemy z jaką łatwością bez specjalistycznej wiedzy mikrobiologicznej oraz funduszów można z dużym prawdopodobieństwem wprowadzić zakażenie na obszar do tej pory wolny od choroby. III) Protesty. Przeanalizujemy również aspekt formowania się ruchów protestu wokół tematu ASF-u na przykładzie Polski (kumulacja protestów wokół wielowymiarowego problemu ASF wystąpiła na początku roku 2019). Przeprowadziliśmy analizę ilościową nowych ruchów protestu : (1) organizacje hodowców trzody chlewnej; (2) organizacje obrońców praw zwierząt; (3) organizacje myśliwych oraz weterynaryjne. Kumulacja protestów w Polsce wokół wielowymiarowego problemu ASF wystąpiła na początku roku 2019. Naszym zdaniem percepcja szeroko pojętego zagrożenia ASF, zwłaszcza w środowisku decydentów, jest niedoszacowana i dokładne zgłębienie tematu jest konieczne, w celu zapewnienia bezpieczeństwa żywnościowego Polski oraz innych krajów NATO / AUSCANNZUKUS.
In our theoretical model, a single person without any special training in microbiology or financing support could release and disseminate ASF virus to disease free territory.
Andrzej Jarynowski1,2 , Vitaly Belik2, Daniel Płatek1, Łukasz Krzowski3, Anton Gerylovich4
Interdisciplinary
Research Institute in Wrocław
System
Modeling Group, Institute for Veterinary Epidemiology and Biostatistics, Freie
Universität Berlin
Military
University of Technology in Warsaw
Institute
of Experimental and Clinical Veterinary Medicine in Khrakiv
Abstract
African Swine Fever (ASF) is a viral infection
which causes acute disease in domestic pigs and wild boar. Although the virus
does not cause disease in humans, the impact it has on the economy, especially
through trade and farming, is substantial causing more than one billion EUR
yearly losses in Eastern Europe and dozens of billions globally. Thus, ASF is a
possible biological weapon, due to: ease of infectious material collection; its
extremely high virulence; multiple transmission route mechanisms; no treatment
and no vaccine; its high resistance to inactivation and devastating impact on
pork production.
In our theoretical model, a single person
without any special training in microbiology or financing support could release
and disseminate ASF virus to disease free territory. In contrast to other biological weapons as
Bacillus anthracis or Variola virus (the respective causative agents of anthrax
and smallpox), terrorist could access virus easily, e.g. by collecting
infectious materials from wild boar carcasses. Sample preparation is simple and
does not require any sophisticated laboratory equipment. Recent development of
portable ASF virus detection kits in middle of 2019 in China increased
feasibility of attack, because until now material diagnosis was the weakest
point in possible intentional introduction protocols. Such a contaminated
material could easily be used for infection of swine or wild boars in new
disease-free territory and seed a new outbreak.
We conclude that rising awareness about the
ease of an intentional ASF introduction to a disease-free region (via
bioterrorism) is an important element of security strengthening and recommend
the use of modeling approach for risk assessment as well its experimental
validation of the international ASF dissemination.
This analysis does not include external
confidential attachment that contains a secret information (possible infection
introduction protocols with demonstrated case studies), when unauthorized
disclosure of the information could cause damage to the national and
international security.
Introduction
ASF “is probably the most serious animal
disease the world has had for a long time, if not ever” said by Dirk Pfeifer, a
veterinary epidemiologist at City University of Hong Kong (Normile, 2019).
Virus is propagating from East to West of Europe (with an average[1]
velocity of 250 km/year by long range “jumps” and around 20km/year by “local
diffusion” (Iglesias, et. al., 2019)) since 2007 (since 2014 in a first NATO/
EU -member countries), and even faster (550 km/year1) in Eastern
Asia (OiE, 2019C). Until now, the full complexity of the processes of ASF
spread in general and human role in particular has not been fully revealed.
Experience shows that eradication is very difficult and, in some conditions,
even almost impossible in already affected region (OiE, 2019C), so arrival of
the virus to a disease-free region may lead to devastation of pork production,
pork being a cheap and an efficient source of proteins especially in
Central/Eastern European diet. There is no treatment and no vaccine available
yet, and it has great impact, as it is non-dangerous to humans (not a zoonosis)
(Cwynar, et al., 2019). To illustrate the impact, only in Poland and Estonia,
after introduction in 2014, due to restrictions up to 90% (in whole Estonia
(Nurmoja, et el., 2019) in some regions of Poland like Podlasie Voivodship
(Dziennik Ustaw, 2019)) of mainly small farms were banned or stopped pig
production. In Ukraine, national pig population decreased almost twice since
ASF introduction in 2012 (FAPA, 2018), (Gospodarz, 2017). ASF is an emerging
epidemiological threat relevant from the perspective of public health in the
sense of ONE Health (Narrod, et al., 2012), for which computational risk
assessment models have been proposed (Jarynowski, Belik, 2019A). After its
introduction as a new very virulent strain in 2007 it caused (Bloomberg, 2018):
– Millions of culled Animals yearly (currently
hundreds of millions since 2018 (ABC, 2019));
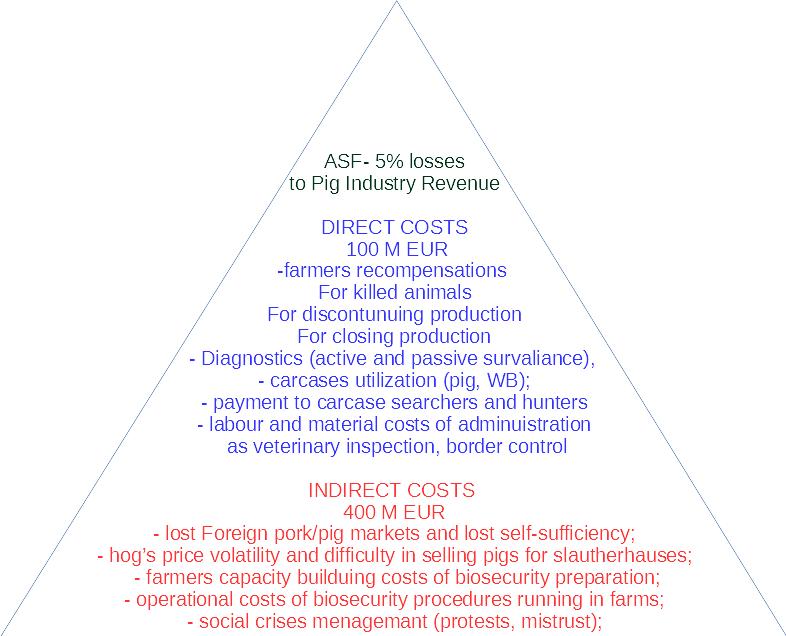
– Dozens of billions of Euros losses yearly (in
Poland 100 million EUR direct (Tygodnik Rolniczy, 2019), (Dziennik Ustaw, 2019)
and around 300 million EUR indirect costs) [Fig. 1];
–A
possible introduction to the USA could cost 20 billions EUR only in first year
(ABC, 2019));
– Complicated and varying from day to day
restrictions (e.g. zones and biosecurity in EU (European Commission, 2014), or
China);
–
Conflict between governments and societies (Chenais, et al., 2019).
Fig. 1) ASF-related
costs structure on the example of Poland.
Public health and
military authorities should study basics of ASF threat, also because it is
possible that ASF virus might be used in a biological attack. The intentional
release of germs (Bertrandt, 2007) that not only can kill livestock or wild
animals, but might cause more economically important indirect impact. New kinds
of biological weapons which fall outside of traditional doctrine of some rogue
state possessing them (e.g. as during Cold War era) can be easily released
alongside inadequate societal preparedness (Maclntyre, 2018). Pork is a key
component for many of dishes in various national cuisines (Magazyn Kuchnia,
2019) (more than 50kg yearly consumption per capita in most of European
countries (AHDB, 2017)) and for example made up to 60% meat consumption (Oh,
2011) in China (before the ASF introduction in 2018). During only 10 months of
the outbreak since August 2018 China (all of 33 mainland provinces have been
already affected (OIE, 2019C)) lost up to 200 million pigs (Reuters, 2019) due
to ASF disease or ASF-triggered restrictions. Since April 2019 pork is not the
most widely consumed meat in the world anymore and the leadership was overtaken
by poultry with global share of 35% (FAO, 2019A). Moreover, perspective seems
to be worse and worse because the disease is affecting the international trade
(opening and closing of borders) and supply/demand (causing huge spatiotemporal
variation of hogs price per kg as 0.5 – 4.5 EUR in China in 2019) having
serious socio-economic impact (Rabobank, 2019), (AgroPolska, 2019). Some
countries in Europe are also suffering shortage of drugs in the middle of 2019
(TVN24, 2019), and some of these medicaments are produced by mainly Chinese
companies. Deliveries had been halted due to factors including work stoppages
in Chinese factories (Polskie Radio, 2019), that produce pharmaceuticals from porcine ingredients (Vilanova, 2019). In this paper,
we are going to present a theoretical scenario of potential intentional
dissemination of ASF virus in epidemiological perspective and discuss a
possible public health decision making response and preparedness.
ASF Epidemiology
ASF is currently a number one threat in
veterinary epidemiology (epizoology) and the whole agricultural sector in EU
(RMF, 2018) and USA (Vet online, 2019C) as well as one of the highest priority
globally (OiE, 2019B), (FAO, 2019B). The main challenge for risk assessment and
prediction of ASF spread lies in the lack of adequate understanding of human
role in this process (Belik, et al., 2011). ASF was first described in Kenya in
1921 and traditionally it has been confined to the African continent. There
were only three introductions, from Africa to Europe: ~1950, ~1980 (e.g. all pigs in the Netherlands were culled),
since 2007 current outbreak started in Georgia. The disease is endemic in
Central/South Africa and Sardinia, however the most virulent genotype II comes
from Caucasus through Eastern Europe and Siberia, then propagate over China and
South Korea and it has recently observed in ASEAN countries as Vietnam,
Cambodia, Thailand, Philippines as well as focally in Belgium (Cwynar, et al.,
2019), (OiE, 2019C). There are few disease registries collecting notifications
on ASF as OiE (The World Organization for Animal Health), FAO (The Food and
Agriculture Organization of UN), ProMED, EFSA (European Food Safety Authority)/
ECDC (European Centre for Disease Prevention and Control). However, there are
various practice about outbreaks notifying and Belarus even being affected
(Cwynar, et al., 2019), (GlobalMeat, 2018) use to deny any ASF outbreak (white
spot on the Fig. 6).
The transmission process is very complex;
however we identify 3 main factors (OiE, 2019A), (EFSA, 2015):
– Wild Boars (WB) can be a host and a biological
vector in the form of carcasses, meat and hunting target;
– Swine or domestic pig (denoted pig later on)
can be a host and a vector as living animal or pork product;
– Human (denoted hum. later on) can a be
mechanical vector;
– Potential tick vector from Ornithodorine family has been described.
Biosecurity in the context of ASF is a strategy
to decrease risks of ASF introduction to farm or region and is an important
element of veterinary infection prevention (Pejsak, 2017). However, perception
and compliance with biosecurity among farmers differ significantly between
countries in accordance with their organizational status and attitudes.
Cultural and behavioral habits of people (seems to be main factor for spread of
disease (EFSA, 2015)) differ substantially (Dors, et al., 2018). In Eastern
Europe fast propagation was mainly due to noncompliance to restrictions
(farmers did not care about biosecurity or traded with infected pork for
profits (Depner, 2018)) and the same reason could drive spread of ASF in
South-East Asia.
Infectious materials in animal-animal
transmission route are: blood, nasal swabs, rectal swabs, vagina swabs, faeces
and tissues (OIE, 2019A). Virus remains viable and there is a possibility of
long-term stability in some uncooked or undercooked meat products (e.g. up to 6
months in smoked ham (FAO 2013)). ASFV can survive for sustained periods and
maintain its infectivity in various environmental conditions as extremes pH and
temperature (Niederwerder, 2019). The diagnostical tool of choice is genetic
analysis such as PCR. However, access to laboratories equipped with
PCR-equipment and supplies for ASF-primers and arrays is limited (e.g. in
Poland till 2018 only one lab could officially perform ASF genetic analysis
(Veterinary Inspectorate, 2019). However, now even portable tests are already
on the market in China since 2019 (Jie, 2019). More available serological tests
(antigen detected from tissue smears or sections by staining e.g. with ELISA)
are characterized with low specificity (high false negative results) due to
death of animal before developing antibodies (preacute form of disease (OiE,
2019A)). There are mobile versions of these serological tests (Gallardo, 2013)
used for example in Africa, Sardine (Cappai, 2018) or China (RingBio, 2019),
could be applied on the field conditions, and PCR test have been currently
developed in China (Jie, 2019), (Miao, et at., 2019), (Kanjiyie, 2018).
However, terrorist any abuse some facilities of already working public or
private accredited laboratories in countries which allows for non-registered
ASFV molecular diagnosis for private/”scientific” reasons. We identify possible
infection routes (EFSA, 2018), (FAO, 2013):
– WB and pig nose-nose and (pig) contact in
farm;
– Feeding on carcasses (pig, but WB are not
showing cannibalism in normal situation and feed on other WB if access to
food/proteins is limed only (EFSA, 2017));
-Swills/Food scraps/Meat rest-overs and
faecal-oral (pig-WB via hum and pig-pig via hum who are feeding animals with contaminated
swills);
-Formites and contaminated environment (pig
directly or indirectly via hum);
– Pork supply chain (pig-pig via hum).
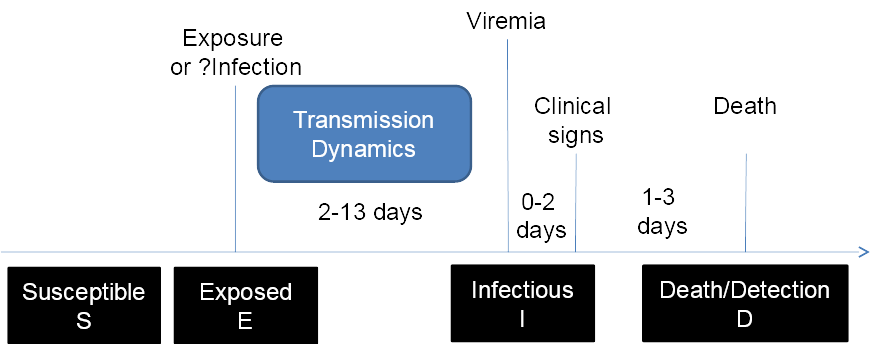
Fig. 2) Pathogenesis of ASF (following notation
will used later on)
Plenty of experiments already realized in vitro/in vivo and field observation
suggest that disease infectivity is relatively low (which has an impact on
potential warfare use), however multiple transmission routes could still cause
rapid propagation in totally susceptible population in a “wave” character
(Cwynar, et al., 2019). Infection probability and infectious dose differ
between various routes of infection. Our current knowledge about ASFV etiology,
pathogenesis increased substantially due to EU overall observation (EFSA,
2017), (EFSA, 2018). Contact infectious route based on UK experiments (Guinat,
et al., 2014), (Guinat, et al., 2016) in quasi natural farm conditions shows
infectivity intra 0.91/day and inter 0.31/day with R0 (epidemic
reproduction rate (Jarynowski, 2011) estimation: around 1.5 (Nielsen, 2017).
Inoculation (S-I ~10 days) and injection (E-I ~ 5 days) experiments form The
Netherlands and Denmark (de Carvalho Ferreira, et al. 2012), (Olesen, et al.,
2017), (Olesen, et al., 2018) suggests 3
day- maximal time period for environmental transmissions, dose dependence in feeding route. German
experiments (Pietschmann, et al. 2015) shows effect of feeding on carcasses
(high infection probability and short incubation period). Longer incubation
(S-I ~15 days) period and non-zero recovery probability was suggested from
Spanish experiment (Gallardo, et al., 2018) and Estonian field observation
(Shulz, et. el., 2019). Posterior field studies in Latvian farm outbreak
investigation (Lamberga, et al, 2018) and in Russian Federation allows the calculation
of basic reproduction rate: interfarm R0
<2, intrafirm R0>3, (Guinat, et al., 2018), (FAO, 2018).
Infection probability per social nose-nose contact seems to in 10-30% range
(Shulz, et el., 2019). However, feeding on carcasses and infections from environment
are main drivers of propagation (Iglesias, et al., 2019) and significantly
differ between location (e. g. Europe, Asia), hosts (WB or pigs), etc. There are satisfactory within- or
between-farms pigs models (Halasa, et al., 2018) or (Pfeiffer, et al., 2008),
and wild boars ecological models (Thulke, et al., 2011), (Taylor, et al.
,2019), moreover the human factor is rarely
integrated in these models (Jarynowski, Belik, 2019A). In Conclusion,
ASFV infectivity per direct contact is low [Fig. 2] and R0 does not
exceeds 1 significantly (barrier value), but it is easy to transmit by many
additional non direct routes (via eating virus-louden pork or feed, via
contaminated farmers/hunter equipment, via flies (Olesen, et al., 2018) or
drinking contaminated water (Niederwerder, et al, 2019)). On average each gram
of tissue (e.g. spleen) can contain 10^12 viruses and 1ml of blood (a single
drop) can contain 10^8 viruses from infected pig/WB. 50% infectious dose (ID50)
(Zimmerman, et al., 2019) for oral track for dry feed is around 10^4 (viruses),
but the liquid feed is much smaller –10^2. Injective ID50 is even smaller –
10^1 (Niederwerder, et al., 2019). So a single drop of blood could be used to
infect 50 million animals (Bloomberg, 2019) without deploying cell line
reproduction and other sophisticated virological techniques.
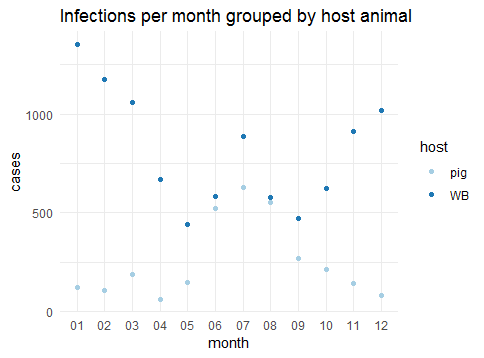
Fig. 3) No. new cases by month of the year
(crude incidence) with characteristic seasonality for both WB and pigs.
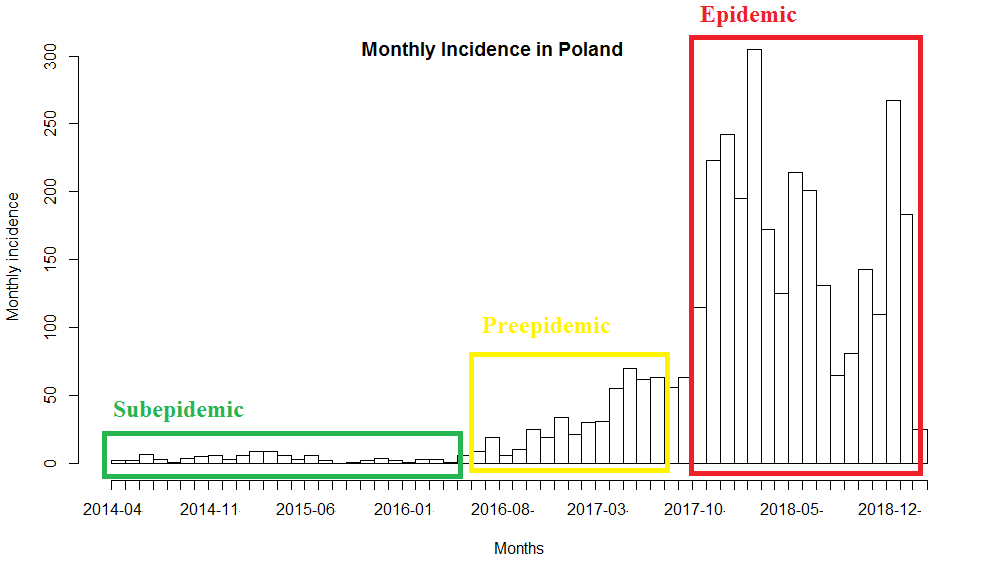
Fig. 4) Time series of No. new cases of monthly
(crude incidence) in Poland with characteristic seasonality and 3 regimes of
the spread: “subepidemic”, “preepidemic” and “epidemic”.
Incidence rates were significantly different
depending on the month of infection detection
[Fig. 3, 4]. The highest incidence rates for domestic pigs were recorded
in summer (June, July, August) and small increase is observed in summer and
also in winter for WB. However, seasonality in WB could be biased by many
factors as hunting insensitivity. A Summer pick [Fig. 3, 4] in incidence in pigs
could be explained by many factors: intensive workload and workers movement due
to harvesting season; farmers habits to attending forest for recreation (e.g.
relax, berries picking and mushrooms hunting), role of mechanical vector as
flies (Olesen, et. al., 2018) or ticks in warmer regions (Vial, et al., 2018).
The virus can circulate in domestic pigs only
(e.g. China), among wild boar populations only (Belgium, Czech Republic –
already eradicated (OiE, 2019D)) and coexist in both populations (e.g. Poland,
Ukraine, Russian Federation). The carcasses and pork products play a role of a
long term reservoir of virus.
There are 2-3 main possible corridors of ASF
propagation to Western Europe [Fig. 5, 6] due to environmental and climatic
conditions (IBI, 2018), (Veterinary Inspectorate, 2017):
North
path goes via Baltic states and North European Plain;
South
-central path goes via Ukraine and Hungarian plateau and Danube valley (and
later to Po valley);
South
path via Moldovan (Galați) corridor to Eastern Balkans.
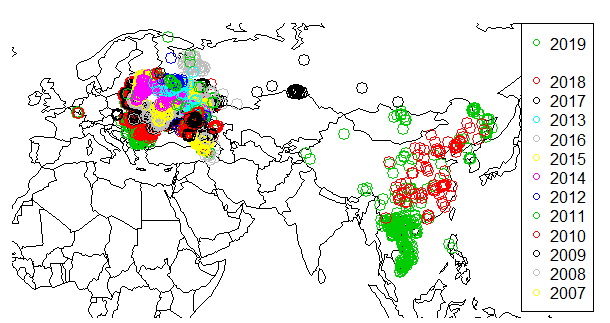
Fig. 5) Clustering of infection notification in
geographical space of ASF Genotype II. Distinguished Northern (Baltic States
and Poland) and South – central (Ukraine trough Hungary and Slovakia) Southern
(Ukraine to Eastern Balkan States) branches in Europe. (colors – years)
There are significant differences between
regions, that can lead to different propagation scenarios. The main factor for
long-term disease sustainability and endemicity is wild boar population. Lack
or low WB density in Carpathian Mountains implies that propagation probably has
been performing via jumps (such as illegal pork products trade) and along
Danube valley (Bartosiak, 2019).
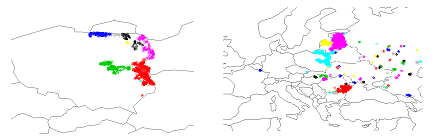
Fig. 6) DBSCAN clustering of infection
notification in Poland and Europe
Besides in Caucasus, Southern Europe and South
East Asia there are soft ticks (as Ornithodoros not existing in most of
Northern/Central Europe) which can be a vector of ASF virus (Vial, et al.,
2018). In China and the United States pork production chain is less modular
(Jayaram, Vickery, 2018) and is more interconnected than in Europe (it could
impose very fast spread, as all 33 Chinese mainland provinces have been
affected in less than one year (OiE, 2019C)).
Poland, Hungary and Romania are on the front
wave in Europe, while for example in Baltic States the disease entered an
endemic phase (e.g. characterized by a high prevalence of seroconverted living
animals due to increased recovery rates states (Shulz, et al., 2019)). Around
30% of the territory of Poland has been affected (in the middle of 2019) and
first signs of endemicity were observed in Podlaskie voivodship (Pejsak,
Truszczyński, 2019).
The recent eradication of a focal introduction
into the Czech Republic (OiE, 2019D) reveals that effective mitigation
strategies and optimal protocols for control measures in timing and zoning are
available (OiE, 2019B). We observed 2 sites in Poland near Kraśnik and near
Lomża without secondary cases, so low contagiousness of the disease with a high
mortality rate could lead to natural outbreak extinction in the very early
phase of epizootic. However, the expansion of the virus as a wave is still not
under control in Europe and Asia (disease transmission to ASEAN countries one
by one in 2019). Recent observations in Russia (Iglesias, et al., 2018),
Ukraine and Baltic states (Shulz, et al., 2019) suggest a mild form of
endemicity of ASF in wild boar population in Europe in next decades, but in
long term adjusted biosecurity standards and surveillance could significantly
reduce cost and burden of disease in domestic pigs.
Social conflicting and fear layer
Low biosecurity levels and illegal trade of
pigs and pork products is the main reason for rapid propagation in EU
neighboring countries and China/Vietnam. ASF has already slightly changed food
consumer behavior in Ukraine (more than 30% shrunk of pork consumption
(Pigprogress, 2019B) and dramatically in China by pork consumption reduction
(Reuters, 2019A). Big release of Belgian pork on EU market and shortage of pork
in China due to ASF caused rapid and unpredicted fluctuation of hog’s price
(e.g. 1.1 – 1.8 EUR per kg in Poland (Wiadomości Handlowe, 2019)). The
intensive fight against ASF in European Union is significantly transforming
regulations and ethics, triggering protests of various groups of interest such
as farmers, hunters and ecologists (animal right activists). New biosecurity
laws and standards (with possible unsatisfactory compliance by small farmers)
are resulting with backlash of farmers against governmental bodies. Many small
producers, who could not comply with new biosecurity rules must close their
farms or change the production profile or become agricultural workers, often
abroad (Pigprogress, 2018). New protest movements are appearing with following
social agents: pig breeders’ organizations, animal welfare organizations,
hunters’ organizations and veterinary organizations. ASF in not a zoonosis, so
it is not dangerous to people, so many citizens or even infectious disease
doctors in affected countries “disregard in dealing with this infection”
(LSM.lv, 2014). The genome for the ASF virus is stable, meaning that
reasortation and mutations could not easily jump the species barrier (LSM.lv,
2014).
Polish Media example
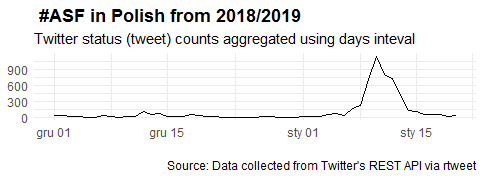
Public awareness about ASF is low, mainly due
to not being human disease [Fig. 7, 8]. The topic of ASF in Poland in the media
practically did not exist from the emergence of the disease in 2014 to the
first outbreaks in pig farms in the summer of 2016. Moreover, arrival of ASF in
Greater Poland (national hub of pig production) may cause social protests at an
unprecedented scale in the III Republic of Poland.
Fig. 7) Google query search trends with
scientists’ letter release on 9.01.2019 (NaukadlaPrzyrody, 2019) on WB
depopulation (ASF phase in Poland)
Only the presentation of the problem on wild
boars and ASF in the open letter of Polish scientists in January 2019
(Conservation, 2019) started a cascade of interest, so level of attention to
the same issue differs over time. Poland has taken drastic but likely ineffective
measures (disregard the science behind) and massively increased culling of wild
boar (Vicente, 2019).
Fig. 8) Daily tweets counts in Polish with
scientists’ letter release (ASF in Poland)
We have preliminary defined main agents in
Polish Media:
Farmers
represented mainly by the Agrounia organization active in social media (e.g.
Facebook), which organizes mass protests in the mild form of happenings (e.g.
„throwing meat”) as well as hard – road blocking.
Animal
rights defenders, protest movement without an indicated main player, active especially
on Twitter and having influencers as bloggers or streamers. They operate mainly
in the area of digital space (e.g. protest letters) and to a little extent in
a particularly engaging ways (e.g. blocking hunting and demonstrations).
Hunters
and environmental / veterinary services, movements involved cognitively in the
ASF problem, but entangled in conflict often against their will (like hunters
implementing government-determined contingents, or underfunded veterinary
services that have more responsibilities due to ASF). They organize themselves
mainly on all social media platforms like Facebook, Twitter or closed online
forums.
The communication dynamics and the conflict
relations between movements are observed. Some farmers blamed veterinary inspection
for ASF propagation and even claim that National Veterinary Institute makes
business out of it which is could be illustrated by the phrase used by farmers:
“Pejsak (the most recognized swine veterinarian), Jurgiel (minister of
agriculture), two nephews, they will cause the end of Polish economy”[2].
Indeed, National Veterinary Institute charged farmers higher cost for ASF
diagnosis than Friedrich-Loeffler-Institute
(National Authority for Animal Diseases) in Germany did (Lubelskie24,
2018) and just recently reduced the cost to less than 20 EUR. Small farmers
blamed big international farming corporates (Agrounia, 2019) as Smithfield
Foods and Pini Pologne, etc., which can easily satisfy biosecurity standard and
increase production. Misunderstanding of ASF epidemiology among farmers
(Agrounia, 2019) and inefficient state response (Vicente, et al., 2019) is
leading to polarization between farmers and state. There is a lot of
controversy of possible routes of introduction of the disease to Poland and
many farmers believe in a rumor that the first (and few others) infected dead
wild boar case in Poland on the border with Belarus was intentionally
introduced by “enemies of Polish economy” (SE, 2018). The possible appearance
of political consultancies[3]
or foreign intelligence in social media, which could polarize society
(Duvanova, et al., 2016), were observed because Twitter accounts, already
potentially classified as suspected (Oko, 2019) were also propagating
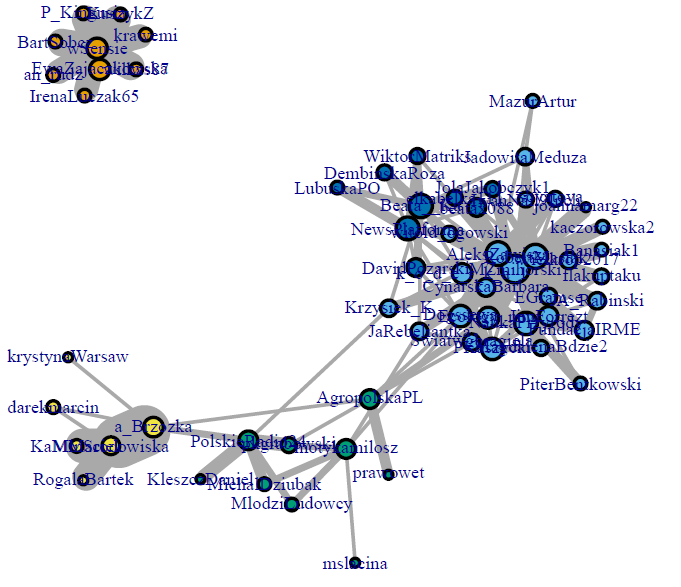
anti-government content which fueled animal right movement [Fig. 9 – yellow
colored]. However, ASF had a small effect only on European Parliamentary
Election 2019, where number of notification correlates negatively with % of
votes (adjusted for pig density confounding effect) for currently ruling country
in Poland (IBI, 2019B).
Fig. 9) Network built on 5285 retweets with
#ASF with tagged language pl from 19.12.2018 to 18.01.2019. Nodes are Twitter
accounts (threshold for node>10 tweets), links is a retweet. Right wing
politicians (orange), Mass media (blue), Animal rights activists (yellow),
Farmers representatives (green)
Risk assessment for ASF introduction
Analyzing possible introduction mechanisms is
crucial for understanding of the disease spread, especially because it was
recently observed in China and Belgium far away from previously affected
regions. Authorities of many countries have started active preparations
(WashingtonPost, 2019) in response that rising ASF can be introduced to a new
territory via (Żuber, 2012), (Elbers, Knutsson, 2013):
Natural
introductions (e.g. WB transmission on the border between countries, which is
for example the most likely path from Russia/Belarus to Baltic States (Cwynar,
et al., 2019));
Accidental
introductions (e.g. most likely introduction to Czech Republic via contaminated
discharged pork products brought by Ukrainian hospital worker or wastes from
trucks in a logistic center (OiE, 2017));
Intentional
disease introductions.
Thus, ASF is a possible biological weapon (Szopa,
et al., 2018), due to:
– easiness of contagious material collection;
– difficulty to secure many farming sites and
forest area (soft targets (Dugdale, 2005));
– its extremely high virulence;
– multiple transmission route mechanisms;
– its high resistance to inactivation;
– no vaccine and treatment;
– difficulty in post disposal investigation and
low treatability due to slow “evolutionary clock” of virus genome (Mazur, et
al., 2019);
– devastating impact on pork production.
However, bioterrorism event does not exist in
reviewed European national surveillance systems (in opposite to US or Australia
for example). In USA’s risk assessment review, bioterrorism is ranked as a
fourth most important introduction path of ASF (Brown & Bevins, 2018) and
authorities recognizes ASF as a main threat in agriculture (Vet Online, 2019C).
Thus, United States public administration tries to be prepared for terrorist
introducing foreign high-risk animal disease as ASF by formulating surveillance
and contingency plan (Gordon, 1986). In Australia, sabotage risk was also
examined (Ausvetplan, 2016). Western European Authorities seem to underestimate
potential role of bioterrorism in ASF introduction and this issue does not
exist e.g. in Germany (FLI, 2019), UK (Defra, 2018), Poland (NIK, 2018),
(MRiRW, 2017) official preparedness plans and possible other Western European
countries. Most of national risk assessments have in common that probability of
introducing ASF by legal trade is almost neglectable (Mur, et al., 2012), (Lu (Y), et al., 2019), so most of attention is
focused on illegal human behavior and failing to restrictions. Focal
introductions of ASF is consider as human-mediated, however main interest
special groups are usually limited only to:
-hunters because of wild boar hunting tourism;
-truck drivers because they travel long
distances throughout Europe and guestarbeiters from affected areas who may
inadvertently discard infected meat products.
There are many pro-active approaches like TV
spots or leaflets (like Netherlands (NVWA.nl, 2018)), active surveillance on
the border (UK, Australia and Japan are permanently collecting positive samples
from fitosanitary border controls (Guardian, 2019)).
OIE classify of release (or entry) by exposure
routes (Defra, 2018):
– Legal trade in live animals and products of
animal origin;
– Illegal trade in live animals or products of
animal origin;
– Fomite transmission, transport or other
identified routes.
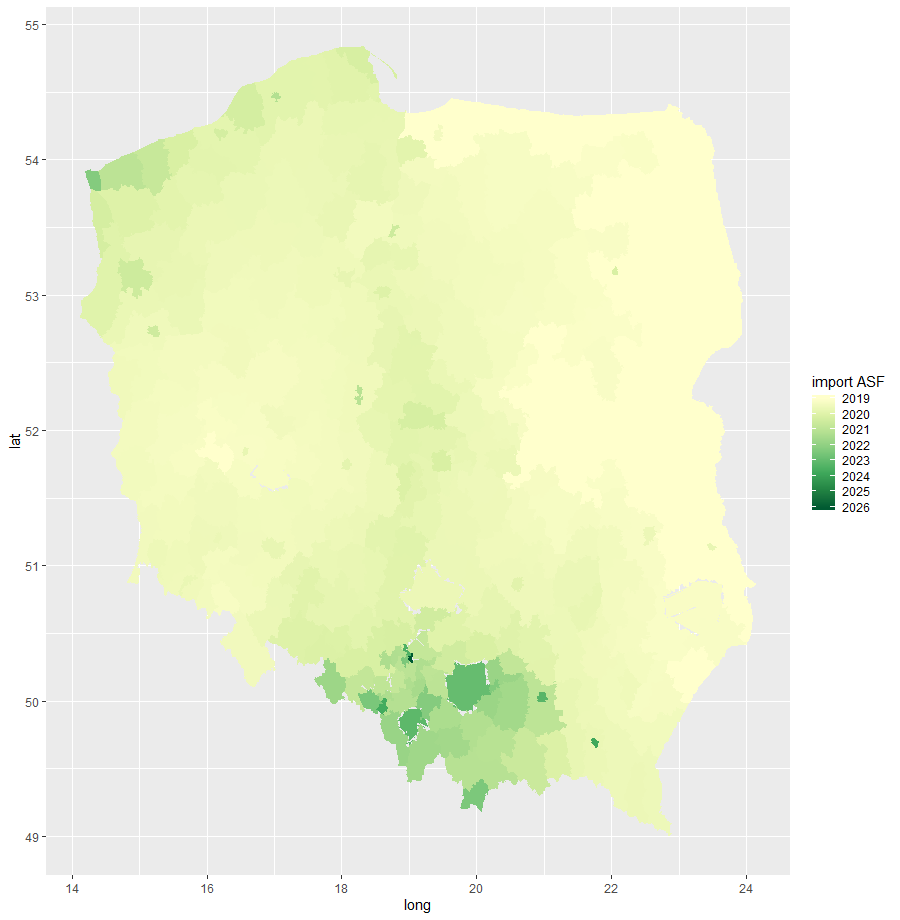
ASF expansion in Europe is according to current
observation ongoing and forecast for future arrival time can be proposed
(Jarynowski, Belik, 2019C) with mathematical modeling and machine learning
approaches, where for example most likely arrival time to Germany is around
2023 and arrival time estimator for Polish counties is publicly available http://interdisciplinaryresearch.eu/index.php/asf.
Disease is devastating trading networks,
permeable land borders and farms with little or no ability to stop spread in
many areas of impact (Ausvetplan, 2016):
̶ livestock health (health of affected species,
including animal welfare);
̶ trade and economic impacts (including
commercial and legal impacts);
̶ environmental impacts;
̶ organisational capacity;
̶ political impacts;
̶ reputation and image.
In countries with high military expenditures
(such as e.g. Australia, USA and Russia), bioterrorism gathers high attention
(FDA, 2003), (CDC, 2008) with special attention on ASF (Selected Agents, 2019),
(Australia Group, 2019), (Voronina, et. al., 2017). However, in bioterrorism
threat perception it is difficult to distinguish information from
disinformation or private opinion from official position (Novosti, 2018).
Moreover, lack of bioterrorism training with veterinary/sanitary inspectors in
Western Europe leads to misunderstanding of propagation paths projections. For
examples, Russian epidemiologists suggested 2 main corridors (Northern and
Southern), which is obvious according to geography (historical European War
Theaters) due to environmental landscape (Bartosiak, 2019). Moreover, computer
simulations are in agreements with such predictions (Mur, et al., 2012),
(Jarynowski, Belik, 2017). On the other hand, Western European veterinarians
were at least confused with such projections (and some were even suspecting intentional
introduction) (Veterinary Inspectorate, 2017).
Taking the calibrated Grunow–Finke Assessment
Tool (Chen, et al., 2018) and agricultural outbreak intentionality index
(Sequera, 1999), (Roberge, 2015) into consideration, we conducted the risk
assessment for intentional ASF introduction [Tab. 1].
Tab. 1) Calibrated Grunow–Finke Assessment Tool
and agricultural outbreak intentionality index for ASF introduction in China
and Belgium
Introduction
calibrated
Grunow–Finke
(Chen,
et al., 2018)
Agricultural
index
(Sequera,
1999)
China
17/60
which means around 30% of terrorism likelihood
5/10
(moderate likelihood of agro terrorism)
Belgium
11/60
which means around 20% of terrorism likelihood
4.5/10
(low to moderate likelihood of agro terrorism)
However, the results should be taken with care,
because the calibrated Grunow–Finke Assessment Tool was developed for human
diseases. Besides risk analysis tools, the rapid surveillance methods are
required to detect unnatural epidemic signals (Dembek, 2016) which should lead
to security practices through innovative uses of psychology and organizational
dynamics to both understand terrorists and train response teams and societies
(MacIntyre, et al., 2018).
Bioterrorism and food safety
Chemical, biological, radiological and nuclear
defense (CBRN defense) is already established protective measures in NATO and
AUSCANNZUKUS military alliances (CDC, 2000). We focus on epidemiology of
infectious diseases which can be used as biological warfare agents.
Identification of CBRN use-related threats and potential enemies, monitoring of
threats, and medical intelligence is a domain of military safety (Maciejwski,
2001) due to restoring capabilities due to new type of hybrid war (EP, 2019).
However, identification of ASF, sanitary procedures, managing a crisis
situation are covered by (as veterinary) public health and public
administration mainly so cooperative civil and military training bridging
security with animal and public health is needed (Bertrandt, et al., 2013).
There are few classifications of potential
agents as CDC (Centers for Disease Control and Prevention in USA (CDC, 2018)):
Highest
risk (high infectivity and mortality rates) as Smallpox (Jarynowski, 2014) or
Anthrax;
Medium
risk (moderate infectivity and morbidity rates) as EHEC E. Coli (Weiser, 2016);
Unknown
risk (unknown infectivity and morbidity rate) for example new generic pathogens
produces by CRISPR/Cas genetic modification, but also ASF itself due
availability and ease of dissemination (CDC, 2019).
Producing biological weapon usually requires
advanced theoretical knowledge in the field of microbiology and technological
experience in this area (Ura, et al., 2015), even in era of do-it-yourself
synthetic biology (Krzowski, et al., 2017), but it is not the case with ASFV,
which can be acquired in sufficient amount directly from environment (e.g. WB
carcasses). ASFV affected meat is harmless to people, but still is a specific
food safety hazards, which touches developed countries as food terrorism
(Dzwolak, 2009). In case of intentional ASF introduction, we could additionally
classify it as agroterrorism with its economic motives and effects on
consumers, producers and agri-food market (Bertrandt, 2007). There have been
just few such confirmed events in the history of the world agriculture (19 in
1915–2000 by according to Monterey), but many more were suspected and never
fully confirmed (Kacperska, 2017). African Swine Fever virus was suspected to
be in arsenal of Soviet bio-agents (Leitenberg, 2012), but current Russian or
North Korean facilities are undocumented and seem not to play such a
significant role after Cold War anymore. ASF was suspected by USSR epizootiologists
to be intentional introduced to Cuba in 1971 (Stegniy, et al. 2015).
Agriculture as pig farming is particularly
susceptible to attempts by terrorists due to difficulty of protecting
(Zawojska, 2011):
– wild boars are geographically dispersed in
unprotected spaces which facilitates access for terrorists,
– pigs are usually concentrated in often
overpopulated farms, which favors the rapid spread of infectious diseases,
– animal pathogens as ASF can be easily
isolated from the environment or obtained from illegal or quasi-legal
laboratories,
– ASFV is very stable and can remain infectious
in meat (but also pieces of death animal) over several months (Juszkiewicz, et
al., 2019);
– Front wave character of ASF makes it easier
for terrorists to virus acquire (e.g. in Poland some people make finding WB
carcasses as source of income due to availability of death animals in recently
affected areas (Okrama, 2018)), detain, transport of pathogens without
jeopardizing their own health.
There are also limitations of ASF effect to
economy and social conflict. Usually, the main expected result of terrorism is
not material, but causing chaos by hysteric and fear in affected society
(Michailiuk, 2016). In ASF case there is
lack of fear is such an extend as in human infectious disease or food-borne
disease (Lue, et al., 2018). Animal diseases as ASF, which are not zoonosis, do
not exist in public awareness, mass culture and media outside of group of
interest (Jarynowski, et al., 2019A). However, fear could be induced by “fake
news” or “dis-information” on ASF effects on human health in social media by
cyberattack for example (Kasprzyk, 2018).
ASF intentional introduction
Pork production collapse caused by terrorism
might be manifested in an economic system through shifts in demand or/and
supply curve (mainly via trade restriction), a variability in the price
(Rabobank, 2019) as well as in the deadweight loss to the society (Zawojska,
2011). It is not possible to exactly indicate and count small groups,
individual criminals and psychopaths who can plan and also commit terrorist
attacks (Chomiczewski, 2003). Rational (planned) terrorist chooses optimal
introduction protocol track (confidential) which maximizes the expected
utility, conditioned to his resources. Irrational (followed by ideology and not
instructed by intelligence directly) terrorist could choose suboptimal tract of
introduction protocol (confidential), conditioned by availability and his
imagination of efficiency (which could be driven by media). There are few
groups of agents, which could be interest in ASF introduction to disease free
in times of international/internal instability not seen since the end of the
Cold War in Europe (EP, 2019). For
example, in USA within FBI’s Weapons of Mass Destruction (FBI, 2009)
Directorate exists Biological Countermeasures bureau identifying such a
potential groups (Vet online, 2019A). State-supported agro/bio attacks have
declined, however other groups and lone wolfs can also be interested in using
bioweapon as ASF due to easiness of using (Keredimis, et al., 2013).
Traditional Terrorist
organization or intelligence agencies of conflicted countries (Macltyre, 2018)
There are organization from countries which
could gain from ASF introduction to some other countries due to high economic
impact of the disease (as other state-sponsored espionage and bio-warfare
programs). They can choose laboratory track with use of microbiologists and spy
conspired in the societies. For example so-called Islamic State – “ISIS” could
use Old Testimonial (Deuteronomy 14, 4-5) and Quran (5:3) meaning of ‘dirty’
for pigs and hit western economy at the same time (state or quasi-state
political/religious/nationalist group (Michailiuk, 2009)). Approx. 4000 people
(who have joined the so-called ‘ISIS’) live currently in Europe and approx. a
million refugees come to Europe yearly, so there is a strong possibility that
potential terrorists are among them (Lech, 2017). Some of potential
collaborators serve as technician or scientists in both medicine or veterinary
field and could be hired by terrorists.
Engagement of criminal cartels and international corporate competitors
may be also considered, while ASF trade restriction could cause massive
economic losses to affected farming sites, but on the other hand could give a
huge handicap to disease free sites.
State sponsored organization could use meat trading market (in
corruption susceptible territories) or drop off the plane infected soft ticks
(in humid and hot areas) (Buzun, 2016). Already affected states can manipulate
with own WB population movement, to flux infected animals to a new territory
(e.g. by driving hunting). Rich organization could sponsor animal right
defending movements, so called “useful idiots” to block adequate sanitary state
reactions (Buzun, et al., 2019).
Recent form as Lone
wolfs or small organizations (Macltyre, 2018)
Some organizations and individuals (Doroszczyk,
2019) with specific interest can profit from ASF introductions (Smith, 2015).
Some of their representatives could make a use of extremely ease of ASF
intentional introduction:
vegans
could benefit of pork production disturbance; unemployed or precariat
biologists could have a much more publicly financed work with ecology
conservation like (domestic or foreign animal- and environmental-rights
groups/individuals). For example, Animal Liberation Front have conduced 700
criminal acts worldwide already (Vet online, 2019C). However, ecoterrorists and
animal rights have involved in violence and vandalism rather than “strict
bioterrorism” (Keremidis, et al., 2013).
fanatic
Islamist or Zionist influenced by xenophobic ideology could appreciate collapse
of “dirty” pig farming according to some holy scrips (home-grown violent
religious extremists as self-radicalized residents or foreign radical
entities). Religious extremists, who have historically caused mass casualties,
may be opposed to western values (Keremidis, et al., 2013);
anti-government
political party would like to benefit from massive protest and country destabilization
(anarchist and anti-government extremist groups);
Mass
casualty sociopaths (individual mentality disorders motivations).
Conductors of such kind of acts could be not
necessary professionals in microbiology, so ASF is an ideal germ for them due
to ease of usage and availability so terrorists can obtain weapon agent and
suitable delivery method with very limited resources (Michailiuk, 2016).
Isolating and breeding ASFV derived from natural sources could make millions of
people to be potential terrorist. However, possible treatability of attack from
such scenarios seems to be not so feasible.
ASF introduction control
Intentional ASF introduction, even being
unlikely must be considered due easiness in comparison to other threats.
Current counterterrorism focus on small groups and lone wolf, so
forecasting
(Najbebauer, et al., 2008) and thwarting of bioterrorist acts is more and more
difficult due to irrational psychological factors, but also more urgent, since
terrorists have easier access to pathogens as ASF and do-it-yourself biological
tools (EC, 2019). Obligatory sanitary inspections on the border should be
conducted across suspected individuals traveling from affected areas (e. g.
similar to Israel policy). However,
interventions with the highest impact and lowest cost should be prioritized and
public health early warning systems should assess this issue (Kasprzyk, et al.,
2010). Active surveillance could strengthen European control as SIGMA Animal
Disease Data Model (EFSA, 2019).
Monitoring
over recent development of mobile universal genetics analysers (cost starts
from 1500 EUR) with possibility to include ASF amplifier on the panel/arrays
(not available on the market global market yet – however tested in China, but
few US and European startups have been also working on it);
Training
emergency management and veterinary public health staff in so called “Animal
Health Joint Criminal and Epidemiological Investigations Workshop” and
promoting concept on ASF as an economic threat
(USDA, 2019), (Veterinary Institute, 2018);
Monitoring
intensive search for WB carcases in front waves countries requested by
strangers (currently mainly Poland, Ukraine and Hungary);
Assessing
several possible smuggling channels in EU (e.g. from Poland to Germany);
Monitoring
flow of air passengers and selective sanitary inspection according to
biological and technological materials (mainly Ukraine, Belarus, Russia in
Europe and China, Vietnam and Cambogia from South East Asia);
Identifying
high risk areas – possible targets (e.g. high pig density and forest density);
Warning
veterinarians and local authorities in high risk areas of possible threats of
ASF and how to protect herds (Vet online, 2019B);
Training
veterinarian and police/military special agents in common outbreak investigations
(Veterinary Institute, 2018), (Vet online, 2019B);
Advising
farmers on informing public administration about any attempt for unauthorized
access, suspicious activity or criminal action in their pig farms in potential
target territories (Vet online, 2019B);
Surveillance
of entering to forest by image processing and machine learning approaches in
potential target territories for unusual behavior, activities, etc.;
Secure
pig carcases from steeling during massive outbreak (Agrointel.ro, 2019);
Monitoring
veterinarian and microbiologist job market for suspicious advertisements;
Monitoring
private and public institution, which allow for paid ASFV molecular diagnosis;
Monitoring
of veterinary and forestry authorities for proper quarantine/restriction
measures introduction in ASF-suspected and ASF outbreaks zones (to avoid
infectious material releases);
Monitoring
activity in legal Internet with artificial intelligence about digital trace
(Najgebauer, et al., 2008) according to patterns (searching and queries on ASF
diagnosis, WB habitat etc.) (Helbing, 2016);
Monitoring
and better understanding topological and dynamical structure of whole food
chain (Weisser, et al., 2016), (Lu, et al., 2019);
Active
surveillance in surrounded area if a new ASF case is suspected or shortly after
its confirmation due to possible simultaneous spread from non-single seeds of
infection (Schirdewahn, et al., 2017).
Procedures prepared after disease
identification does not differ between intentional and non-intentional introduction
and can be found in many guidelines for ASF specific (Ausvetplan, 2016) or
general emergency operations in the face of biological hazard (Trzos, et al., 2017). Collaboration between farmers
(biosecurity standards), governmental institutions (veterinary inspection) and
hunting associations (WB depopulation) can achieve significant decrease of the
disease impact (Cwynar, et
al., 2019).
Conclusions
Permanently ASF affected counties have lost
international pigs and pork market position by relaying more and more on import
and even changed their consumption habits (e.g. less than one year of ASF in
China probably cause more problems in “country of Dragons” than trade war with
USA (Globalresearch, 2019)). According to Sub-Committee on Security and Defence
of European Parliament “Repeated attacks by both State and non-state actors
(…), reminds that (…) the European Union is far from
being immune to CBRN threats” (EP, 2019). „ASF can be understood as a
biological weapon (…) equivalent to bioterrorism[4]?, said Russian Chief Veterinary Officer – S. Dankvert
(Rosselkhoznadzor, 2013). We conclude that rising awareness about the easiness
of ASF introduction to a disease-free region (e.g. via
bioterrorism/agroterrorism) is an important element of security strengthening.
New challenges in public health security such as lone wolf engagement can no
longer be addressed within the isolated ivory tower of veterinary medicine, but
require cross-disciplinary solutions from other fields (as e.g. One Health
Initiative). The implementation of that change should lead to focus on
pathogens, which be freely available outside professional laboratories and
could become a weapon within do-it-yourself biology as ASFV (MacIntyre, et al.,
2018). Thereby, the
ease of using ASF with the commercial materials only in one’s kitchen should be
counteracted by hazard monitoring system. Before ASFV, it was extremely difficult for
potential terrorists to produce/purchase/steel
a strain with given properties, and even “do-it-yourself” synthetic biology
(Krzowski, 2017) is far more advanced technologically in comparison to ease of
performing intentional ASF-spread. Billions EUR losses to targeted economy
could be easily achieved with ASFV – “a weapon of mass destruction for the
poor” by even single determinate person, who is intelligent and enough to
understand scientific papers and published information in the Internet and
apply knowledge in practice.
In particular, despite significant research
efforts, analysis and modelling of ASF notification events, its spatiotemporal
epidemiology due to human role are hardly considered, although being crucial
for understanding of the ASF spread. Collaboration between veterinary/sanitary
and civil/military inspection must be enhanced as well as various experience as
simulation practise must be exchanged (Bertrandt, et al., 2013) for optimal solution finding for
such an interdisciplinary problem. Eradication is extremely difficult in WB
(Depner, 2018) and difficult in farms (Pejsak, 2017) in already affected region,
so ASF will definitely affect new country food supply chain (Kielan, 2019),
(Bertrandt, 2009). Intentional introduction could happen on scale: of single
county (e.g. from Eastern to Western Poland); intracontinental (e.g. from
Eastern to Western Europe); intercontinental (e.g. from China to USA). However,
adequate counter-terrorism practice would be very difficult to prepare and to
accept by societies.
In this paper, we want to share our own
reflections form infectious disease/epidemiological (epizootic) point of view.
Long term persistence in the environment and virus stability (ease to collect
infectious material), and high case fatality rate, relatively low
contagiousness but many infectious routes with no possible treatment and
vaccination (make it very complicated to control) makes the virus (Chanais, et
al., 2019) a potential biological warfare.
We show theoretical model of using ASF as a
biological weapon (with feasibility analysis for various potential path) and an
accessible epidemiological analysis with an accent on the indirect costs of the
disease (as trade restriction and conflicting societies). The main idea is to
present a protocol for the collection (from carcases, pork products or culture)
/ processing (blood, tissue, body pieces preparation) / infecting (injection or
feeding WB/pigs) with infectious material. We have identified potential
categories of terrorists as sophisticated intelligence, small organizations and
lone wolfs. We proposed few possible dissemination case studies, which do not
need to be well prepared and expensive, to archive relatively high success
rate.
Described ASF introduction problem should be
carefully revisited due to new circumstances since cheap, sensitive and
specific portable ASF-detection kit were developed in the middle 2019 in China
(Miao, et al., 2019), for proper risk assessment and guidelines preparation for
training the public health providers in emergency response in still
disease-free territories. Technically we suggest: building risk maps;
supporting biosurveillance, biosafety and biosecurity; monitoring technology
development and related radical ideation (GlobalDefence, 2018) in order develop a plan for decision-makers in
a crisis situation (Trzos, et al., 2017). Delaying the introduction time by
these measures is also relevant, while the race to developments vaccine
(Barasona, et al., 2018), (Reuters, 2019B) or treatment continues, especially in world leading
biotechnological research centres as of the most affected country – China
(Reuters, 2019C), (Mallapaty, 2019). However no spectacular break thought was
not observed yet (PigSite, 2019), so in a next few years perspective, we could
only consider preventive measures (AgrarHeute, 2019), (Scientist, 2019).
Compliance to biosecurity rules seems in long terms to be the main and
relatively effective measure to control disease in already affected regions
(Depner, 2018), (Reuters, 2019D).
Most probable and most effective Introduction
protocols and case studies (appendix of this analysis) should be confidential
with limited access by authorized bodies, because disclosure of this
information could be used to plan an attack without the need of own
conceptualization (Ludwiczak, 2005).
Acknowledge: This research was partly supported
by ASF-STOP (Cost Action CA15116) and PNFN 2019-21.
Barasona, J. A., Gallardo, C.,
Cadenas-Fernández, E., Jurado, C., Rivera, B., Rodríguez-Bertos, A., … &
Sanchez-Vizcaino, J. M. (2019). First oral vaccination of Eurasian wild boar
against African swine fever virus genotype II. Frontiers in Veterinary Science, 6, 137.
Bartosiak
J (2019) Przeszłość jest prologiem, Zona Zero
Belik, V., Geisel, T., & Brockmann, D. (2011).
Natural
human mobility patterns and spatial spread of infectious diseases. Physical Review X, 1(1), 011001.
Bertrandt
J. (2007) Bioterroryzm żywnościowy – realne zagrożenia użycia patogenów
biologicznych w działaniach terrorystycznych, „Lekarz Wojskowy”, 2007;83/1, s.
33-35.
Bertrandt
J. (2009) Bezpieczeństwo Żywności. in: Bezpieczeństwo wewnętrzne państwa :
wybrane zagadnienia / red. nauk. Stanisław Sulowski, Michał Brzeziński.
978-83-7151-846-1
Bertrandt,
J., Netczuk, A., Nowicki, T., & Tarnawski, T. (2013). Modelowanie,
symulacja i analiza procesu rozwoju epidemii chorób przenoszonych drogą
pokarmową. Roczniki Kolegium Analiz Ekonomicznych SGH, Zeszyt, 29, 2013.
Brown, V. R., & Bevins, S.
N. (2018). A review of African swine fever and the potential for introduction
into the United States and the possibility of subsequent establishment in feral
swine and native ticks. Frontiers in veterinary science, 5, 11.
Buzun, A . (2016). THREAT OF
HIDDEN SPREAD OF THE AFRICAN SWINE FEVER AS AN CONCURRENT INFCTIONS IN UKRAINE.
CBEP Ukraine Research Forum and Peer Review Session, 100, 72–75.
Buzun, A., Bolotin, W.,
STEGNIY, B. (2019) AGRO-TERRORISTIC ASPECTS OF EMERGENCY OF ANIMAL INFECTIONS (Бузун
А.І., Болотін В.І., Стегній Б.Т. (2019) АГРОТЕРОРИСТИЧНІ АСПЕКТИ ЕМЕРДЖЕНЦІЇ
ІНФЕКЦІЙ ТВАРИН, „ІНФЕКЦІЙНІ ХВОРОБИ СУЧАСНОСТІ: ЕТІОЛОГІЯ, ЕПІДЕМІОЛОГІЯ,
ДІАГНОСТИКА, ЛІКУВАННЯ, ПРОФІЛАКТИКА, БІОЛОГІЧНА БЕЗПЕКА” конференція
пам’яті академіка Л.В. Громашевського
)10-11 жовтня 2019року,м. Київ.)
Cappai, S., Sanna, G., Loi,
F., Coccollone, A., & Marrocu, E. (2018). African swine fever Detection on
Field with Antigen Rapid Kit Test. J Anim Sci Res, 2(3).
CDC (2000) Biological and
Chemical Terrorism: Strategic Plan for Preparedness and Response,
Recommendations of the CDC Strategic Planning Workgroup. U.S. Centers for
Disease Control and Prevention. 49 Morbidity and Mortality Weekly Report,
Recommendations and Reports (RR-4): 5-8.
Chen, X., Chughtai, A. A.,
& MacIntyre, C. R. (2018). Recalibration of the Grunow–Finke Assessment
Tool to Improve Performance in Detecting Unnatural Epidemics. Risk Analysis. 13255
Chenais, E., Depner, K., Guberti, V., Dietze, K.,
Viltrop, A., & Ståhl, K. (2019). Epidemiological considerations on African swine
fever in Europe 2014–2018. Porcine health
management, 5(1), 6.
Chomiczewski,
K. (2003) Zagrożenie bioterroryzmem. Przegląd Epidemiologiczny; 57:349-53
Cwynar,
P., Stojkov, J., & Wlazlak, K. (2019). African Swine Fever Status in
Europe. Viruses, 11(4), 310.
de Carvalho Ferreira, H. C.,
et al. (2012) „African swine fever virus excretion patterns in
persistently infected animals: a quantitative approach.” Veterinary
microbiology 160.3 327-340.
Dembek, Z. F. (Ed.). (2016).
USAMRIID’s medical management of biological casualties handbook. Government
Printing Office.
Derfa (2018) Qualitative risk
assessment What is the risk of introducing African swine fever to the UK pig
population from European Member States via human-mediated routes?
Doherr, M. G., & Audige, L. (2001). Monitoring and
surveillance for rare health-related events: a review from the veterinary
perspective. Philosophical Transactions of the Royal Society of London. Series
B: Biological Sciences, 356(1411), 1097-1106.
Doroszczyk, J. (2019) Analysis
of the “lone wolf” phenomenon in the context of the Leaderless Resistance
Strategy. SJMULF 2019; 192 (2) : 173-189
Dors,
A., Czyewska-Dors, E., Pomorska-Mol, M., & Pejsak, Z. (2018). Biosecurity
in Polish pig farms-a questionnaire survey. BERLINER UND MUNCHENER
TIERARZTLICHE WOCHENSCHRIFT, 131(1-2), 31-36.
Duvanova, D., Semenov, A., & Nikolaev, A.
(2015). Do
social networks bridge political divides? The analysis of VKontakte social
network communication in Ukraine. Post-Soviet Affairs, 31(3), 224-249.
Dziennik
Ustaw Rzeczpospolitej Polskiej (2019) Dz.U.2019.598
Dzwolak,
W. (2009). Terroryzm żywnościowy-czynniki zagrożenia. Przemysł spożywczy, 63, 43-45.
EC -European Commission
(2014), Decision concerning animal health control measures relating to African
swine fever in certain Member States and repealing Implementing, 2014/709/UE
EFSA reports as: Boklund, A.,
Cay, B., Depner, K., Földi, Z., Guberti, V., Masiulis, M., … & Spiridon,
M. (2018). Epidemiological analyses of African swine fever in the European
Union (November 2017 until November 2018). EFSA Journal, 16(11)
EFSA reports as: Depner, K.,
Gortazar, C., Guberti, V., Masiulis, M., More, S., Oļševskis, E., … &
Gogin, A. (2017). Epidemiological analyses of African swine fever in the Baltic
States and Poland. EFSA Journal, 15(11).
Elbers, A., & Knutsson, R.
(2013). Agroterrorism targeting livestock: a review with a focus on early
detection systems. Biosecurity and bioterrorism: biodefense strategy, practice,
and science, 11(S1), S25-S35.
European Food Safety Authority
(EFSA), Zancanaro, G., Antoniou, S. E., Bedriova, M., Boelaert, F., Gonzales
Rojas, J., … & Thulke, H. H. (2019). SIGMA Animal Disease Data Model: A
comprehensive approach for the collection of standardised data on animal
diseases. EFSA Journal, 17(1), e05556.
FAO
repots as: Khomenko, S., Beltrán-Alcrudo, D., Rozstalnyy, A., Gogin, A.,
Kolbasov, D., Pinto, J., … & Martin, V. (2013). African swine fever in the
Russian Federation: risk factors.
FDA/CFSAN (2003). Risk
Assessment for Food Terrorism and Other Food Safety Concerns. U.S. Food and
Drug Administration, Center for Food Safety and Applied Nutrition, Office of
Regulations and Policy.
FLI (2019) Qualitative Risikobewertung zur
Einschleppung der Afrikanischen Schweinepest aus Verbreitungsgebieten in Europa
nach Deutschland
Gallardo, C., Soler, A.,
Nieto, R., Carrascosa, A. L., De Mia, G. M., Bishop, R. P., … & Pelayo,
V. (2013). Comparative evaluation of novel African swine fever virus (ASF)
antibody detection techniques derived from specific ASF viral genotypes with
the OIE internationally prescribed serological tests. Veterinary microbiology,
162(1), 32-43.
Gallardo, C., Nurmoja, I.,
Soler, A., Delicado, V., Simón, A., Martin, E., … & Arias, M. (2018).
Evolution in Europe of African swine fever genotype II viruses from highly to
moderately virulent. Veterinary Microbiology, 219, 70-79.
Guinat, Claire, et al.
„Dynamics of African swine fever virus shedding and excretion in domestic
pigs infected by intramuscular inoculation and contact transmission.”
Veterinary research 45.1 (2014): 93.
Guinat, C., et al.
„Inferring within‐herd transmission parameters for African swine fever
virus using mortality data from outbreaks in the Russian Federation.”
Transboundary and emerging diseases 65.2 (2018): e264-e271.
Halasa, T., Bøtner, A., Mortensen, S., Christensen,
H., Wulff, S. B., & Boklund, A. (2018). Modeling the effects of
Duration and size of the control Zones on the consequences of a hypothetical
african swine Fever epidemic in Denmark. Frontiers in veterinary science, 5,
49.
Helbing, D. (2016). The Automation
of society is next. Zurich, ETH.
Herrera-Ibatá, D. M.,
Martínez-López, B., Quijada, D., Burton, K., & Mur, L. (2017). Quantitative
approach for the risk assessment of African swine fever and Classical swine
fever introduction into the United States through legal imports of pigs and
swine products. PloS one, 12(8), e0182850.
Iglesias, I., Martínez, M., Montes, F., & de
la Torre, A. (2019). Velocity of ASF spread in wild boar in the European
Union (2014–2017). International Journal of Infectious Diseases, 79, 69.
Iglesias, I., Montes, F., Martínez, M., Perez, A.,
Gogin, A., Kolbasov, D., & de la Torre, A. (2018). Spatio-temporal kriging
analysis to identify the role of wild boar in the spread of African swine fever
in the Russian Federation. Spatial statistics, 28, 226-235.
Jarynowski, A. (2011).
Human-Human interaction: epidemiology.in Life-time of correlations, WN:
Wroclaw/Glogow.
Jarynowski, A., & Rostami,
A. (2013). Reading Stockholm Riots 2013 in social media by text-mining. [in:]
6th Language & Technology Conference, Poznań, Poland, December 7-9, 2013
(pp. 353-358). Wydawnictwo Naukowe Uniwersytetu im. Adama Mickiewicza.
Jarynowski, A. (2014)
Agent-based model of great epidemics. Case studies: Wroclaw (smallpox,
1687-1691) and Warsaw (plague, 1624-1625), poster ENIC 2014
Jarynowski, A., Marchewka, D.,
Grabowski, A, (2016) Computer-assisted risk assessment of hospital infections:
a preliminary implementation in Polish hospitals, Journal of Hospital Infection
94S1, S128
Jarynowski, A., Belik, V.
(2017). Modeling the ASF (African Swine Fever) spread till summer 2017 and risk
assessment for Poland, Seminarium zastosowan matematyki s21-28
Jarynowski,
A., Belik, V. (2018). Choroby przenoszone drogą płciową w dobie Internetu i
E-zdrowia – kalkulatory ryzyka. [in:] „Człowiek Zalogowany”, Tom 5 „Cyfrowa
Miłość”, s 101, WUJ.
Jarynowski,
A., Belik, V. (2019B). Possible effect on border fencing and animal corridors
blocking on African Swine Fever (ASF) Virus propagation in Poland (poster: NCBJ Warsaw 04.07.2019) (available http://userpage.fu-berlin.de/ajarynowski/swierk_jarynowski_2019.pdf)
Jarynowski,
A., Buda, A., Paradowski, MB. (2019B) MODELLING COMMUNITIES AND POPULATIONS.
INTRODUCTION TO COMPUTATIONAL SOCIAL SCIENCE (accepted Methodological Studies)
Jayaram, J., & Vickery, S.
(2018). The role of modularity in the supply chain context: current trends and
future research directions.
Jie, Z. et al., (2019), ASF in
China, International Scientific Conference for Swine Veterinarians in Cracow
Juszkiewicz,
M., Walczak, M., & Woźniakowski, G. (2019). Characteristics of selected
active substances used in disinfectants and their virucidal activity against
ASFV. Journal of Veterinary Research,
63(1), 17-25.
Kacperska,
E. (2017) Terroryzm międzynarodowy jako problem globalny współczesnej
gospodarki, EKONOMIKA i ORGANIZACJAGOSPODARKI ŻYWNOŚCIOWEJ, NR 12
Kasprzyk, R., et al. (2010)
“Creative Application to Remedy Epidemics”. Risk Analysis VII and Brownfields
V, 545-562.
Kasprzyk, R. (2018). The
Essence of Reflexive Control and Diffusion of Information in the Context of
Information Environment Security. In International Conference on Intelligent
Systems in Production Engineering and Maintenance (pp. 720-728). Springer,
Cham.
Keremidis, H., Appel, B.,
Menrath, A., Tomuzia, K., Normark, M., Roffey, R., & Knutsson, R. (2013).
Historical perspective on agroterrorism: lessons learned from 1945 to 2012.
Biosecurity and bioterrorism: biodefense strategy, practice, and science,
11(S1), S17-S24.
Kielan,
A., & Niemialtowski, M. (2014). Zastosowanie wirusów jako broni
biologicznej przeciwko zwierzętom gospodarskim. Medycyna Weterynaryjna, 70(04).
Krzowski,
Ł., Krzowska A. (2017) Biologia syntetyczna a bioterroryzm. In Epimilitaris
2017. Mundurowe i cywilne służby medyczne wobec współczesnych zagrożeń”, Anna
Mróz-Jagiełło Redaktor, Adam Brzozowski Redaktor, ISBN 9788394395872
Lapidge, S., Wishart, J.,
Staples, L., Fagerstone, K., Campbell, T., & Eisemann, J. D. (2012).
Development of a feral swine toxic bait (Hog-Gone®) and bait hopper
(Hog-Hopper™) in Australia and the USA.
Lech, P. (2017).
Unconventional Terrorism as a Potential Threat to Poland. Bezpieczeństwo i
Technika Pożarnicza, 46(2), 100-113.
Luo, J., Wang, J., Zhao, Y., & Chen, T.
(2018). Scare
Behavior Diffusion Model of Health Food Safety Based on Complex Network.
Complexity, 2018.
Lamberga K, Seržants M,
Oļševskis E, (2018). African swine fever outbreak investigations in a large
commercial pig farm in Latvia: a case report, Berliner und Münchener
Tierärztliche Wochenschrift
Leitenberg, M., Zilinskas, R. A., & Kuhn, J.
H. (2012). The Soviet biological weapons program: a history. Harvard University
Press.
Lu, Y., Deng, X., Chen, J.,
Wang, J., Chen, Q., & Niu, B. (2019). Risk analysis of African swine fever
in Poland based on spatio-temporal pattern and Latin hypercube sampling,
2014–2017. BMC veterinary research, 15(1), 160.
Lu, X., Horn, A. L., Su, J.,
& Jiang, J. (2019). A Universal Measure for Network Traceability. Omega, 87, 191-204.
Ludwiczak,
H. (2005) Biobezpieczeństwo a publikacje naukowe. Biotechnologia 4 (71)
227-231
Maciejewski,
J. (Ed.). (2001). Socjologiczne aspekty bezpieczeństwa narodowego (Vol. 31).
Wydawnictwo Uniwersytetu Wrocławskiego.
MacIntyre,
C. R., Engells, T. E., Scotch, M., Heslop, D. J., Gumel, A. B., Poste, G., … & Broom, A.
(2018). Converging and emerging threats to health security. Environment Systems
and Decisions, 38(2), 198-207.
Mallapaty, S. (2019). Spread
of deadly pig virus in China hastens vaccine research. Nature569,
13-14.
Mazur-Panasiuk, N., &
Woźniakowski, G. (2019). The unique genetic variation within the O174L gene of
Polish strains of African swine fever virus facilitates tracking virus origin.
Archives of virology, 164(6), 1667-1672.
Miao, F., Zhang, J., Li, N., Chen, T., Wang, L.,
Zhang, F., … & Zhou, X. (2019). Rapid and sensitive recombinase polymerase
amplification combined with lateral flow strip for detecting African swine
fever virus. Frontiers in microbiology,
10.
Michailiuk
B, (2009) Terroryzm bronią masowego rażenia jako zagrożenie bezpieczeństwa,
[w:]
Katastrofy naturalne i cywilizacyjne. Zagrożenia i wyzwania dla
bezpieczeństwa, tom 2, Żuber M. (red.), WSOWL, Wrocław
Michailiuk
B. (2016) Broń biologiczna i bioterroryzm, „Zeszyty Naukowe AON” 1(106).
Morelle
K, Podgórski T, Prévot C, Keuling O, Lehaire F, Lejeune P, . 2015. Towards
understanding wild boar Sus scrofa movement: a synthetic movement ecology
approach. Mammal Review 45 : 15-29. DOI:
10.1111/mam.12028
Morelle,
K., Jezek, M., Licoppe, A., & Podgorski, T. (2019). Deathbed choice by
ASF‐infected wild boar can help find carcasses. Transboundary and emerging
diseases.
Mur, L., Martínez‐López, B.,
Martínez‐Avilés, M., Costard, S., Wieland, B., Pfeiffer, D. U., &
Sánchez‐Vizcaíno, J. M. (2012). Quantitative risk assessment for the
introduction of African swine fever virus into the European Union by legal
import of live pigs. Transboundary and emerging diseases, 59(2), 134-144.
Najgebauer,
A., Antkiewicz, R., Chmielewski, M., & Kasprzyk, R. (2008). The prediction of
terrorist threat on the basis of semantic association acquisition and complex
network evolution. Journal of Telecommunications and Information Technology,
14-20.
Narrod, C., Zinsstag, J.,
& Tiongco, M. (2012). A one health framework for estimating the economic
costs of zoonotic diseases on society. EcoHealth, 9(2), 150-162.
Niederwerder, M. C., Stoian,
A., Rowland, R., Dritz, S. S., Petrovan, V., Constance, L. A….Hefley, T. J.
(2019). Infectious Dose of African Swine Fever Virus When Consumed Naturally in
Liquid or Feed. Emerging Infectious Diseases, 25(5), 891-897.
https://dx.doi.org/10.3201/eid2505.181495.
Nielsen, J. P., et al.
„Estimation of the transmission dynamics of African swine fever virus
within a swine house.” Epidemiology & Infection 145.13 (2017):
2787-2796.
Nurmoja, I., Mõtus, K., Kristian, M., Niine, T.,
Schulz, K., Depner, K., & Viltrop, A. (2018). Epidemiological analysis of
the 2015–2017 African swine fever outbreaks in Estonia. Preventive veterinary
medicine.
Olesen, Ann Sofie, et al. „Transmission of African
swine fever virus from infected pigs by direct contact and aerosol
routes.” Veterinary microbiology 211 (2017): 92-102.
Olesen, A. S., et al.
„Short time window for transmissibility of African swine fever virus from
a contaminated environment.” Transboundary and emerging diseases (2018).
Olesen, A. S., Lohse, L.,
Hansen, M. F., Boklund, A., Halasa, T., Belsham, G. J., … & Bødker, R.
(2018). Infection of pigs with African swine fever virus via ingestion of
stable flies (Stomoxys calcitrans). Transboundary and emerging diseases, 65(5),
1152-1157.
Pejsak,
Z., Wozniakowski, G., Smietanka, K., Zietek-Barszcz, A., Bocian, L., Frant, M.,
& Niemczuk, K. (2017). Przewidywany rozwój sytuacji epizootycznej w
zakresie afrykańskiego pomoru świń w Polsce. Życie Weterynaryjne, 92(04).
Pejsak, Z., &
Truszczyński, M. (2019). Wild boar as the most important reservoir and vector
of transmission of the African swine fever virus; why do we have to restrict
their population. NAUKA, (1).
Pfeiffer, D., Robinson, T. P.,
Stevenson, M., Stevens, K. B., Rogers, D. J., & Clements, A. C. (2008).
Spatial analysis in epidemiology (Vol. 142, No. 10.1093). Oxford: Oxford
University Press.
Pietschmann, J., et al.
(2015): „Course and transmission
characteristics of oral low-dose infection of domestic pigs and European wild
boar with a Caucasian African swine fever virus isolate.” Archives of virology
160.7, 1657-1667.
Podgórski, T., Apollonio, M.,
& Keuling, O. (2018). Contact rates in wild boar populations: Implications
for disease transmission. The Journal of Wildlife Management, 82(6), 1210-1218.
Podgórski, T., Borowik, T.,
Łyjak, M., & Woźniakowski, G. (2019). Spatial epidemiology of African swine
fever: host, landscape and anthropogenic drivers of disease occurrence in wild
boar. Preventive veterinary medicine, 104691.
Schirdewahn, F., Colizza, V., Lentz, H. H., Koher,
A., Belik, V., & Hövel, P. (2017). Surveillance for outbreak
detection in livestock-trade networks. In Temporal Network Epidemiology (pp.
215-240). Springer
Schulz, K., Staubach, C., Blome, S., Viltrop, A.,
Nurmoja, I., Conraths, F. J., & Sauter-Louis, C. (2019). Analysis of
Estonian surveillance in wild boar suggests a decline in the incidence of
African swine fever. Scientific reports, 9(1), 8490.
Sequeira R. (1999) “Safeguarding production
agriculture and natural ecosystems against biological terrorism: A U.S.
department of agriculture emergency response framework”. In Food and
Agricultural Security: guarding against natural threats and terrorist attacks
affecting health, national food supplies, and agricultural economics. Ed.
Frazier, Thomas W. Richardson, Drew C., Vol. 894, Annals of the New York
Academy of Sciences, New York, NY, 48-67.
Smith, B. L., Gruenewald, J.,
Roberts, P., & Damphousse, K. R. (2015). The emergence of lone wolf
terrorism: Patterns of behavior and implications for intervention. In Terrorism
and counterterrorism today (pp. 89-110). Emerald Group Publishing Limited.
Stegniy, B., Gerilovich, A., Buzun, A., et al. (2015) African
Swine Fever: Background, Present Time, and Prospects. Kyiv, Ukraine: ST
Druk (Стегній Б, Герилович А, Бузун А та
ін. (2015) Африканська чума свиней: історія, сьогоденна та перспективи. Київ,
Україна: друк)
Szopa,
M., Leśków, A., Tarnowska, M., Sarnowska, M., Wysocki, A., Pieńkowski, M.,
& Wrzesiński, J. A. (2018). Biosafety and biological factors. Journal of
Education, Health and Sport, 8(9), 973-982.
Taylor, R. A., Podógrski, T.,
Simons, R. R., Ip, S., Gale, P., Kelly, L. A., & Snary, E. L. (2019).
Predicting spread and effective control measures for African swine fever-should
we blame the boars?. bioRxiv, 654160.
Thulke, H. H., Eisinger, D.,
& Beer, M. (2011). The role of movement restrictions and pre-emptive
destruction in the emergency control strategy against CSF outbreaks in domestic
pigs. Preventive veterinary medicine,
99(1), 28-37.
Trzos, A., Krzowski, Ł., &
Długosz, K. (2017) Specyfika działań ratownictwa medycznego. Na Ratunek 4/17
Vial, L., Ducheyne, E., Filatov, S.,
Gerilovych, A., McVey, D. S., Sindryakova, I., … & De Clercq, E. M.
(2018). Spatial multi-criteria decision analysis for modelling suitable
habitats of Ornithodoros soft ticks in the Western Palearctic region.
Veterinary parasitology, 249, 2-16.
Vicente, J., Apollonio, M., Blanco-Aguiar, J.
A., Borowik, T., Brivio, F., Casaer, J., … & Gortázar, C. (2019).
Science-based wildlife disease response. Science (New York, NY), 364(6444),
943.
Vilanova, E., Tovar, A. M., & Mourão, P. A. (2019). Imminent risk of a global shortage
of heparin caused by the African Swine Fever afflicting the Chinese pig herd.
Journal of Thrombosis and Haemostasis, 17(2), 254-256.
Utnik-Banaś, K. (2015).
Struktura gospodarstw specjalizujących się w produkcji trzody chlewnej w Polsce
The structure of farms specialising in pig production in Poland. Problemy Drobnych Gospodarstw Rolnych
Problems of Small Agricultural Holdings, 69.
Weiser, A. A., Thöns, C., Filter, M., Falenski,
A., Appel, B., & Käsbohrer, A. (2016). FoodChain-Lab: a trace-back and
trace-forward tool developed and applied during food-borne disease outbreak
investigations in Germany and Europe. PLoS One, 11(3), e0151977.
Voronina, V.A, Petrova, O.H., (2017) The
bioterrorism. Protection and control strategy on the example of African swine
fever, International Agricultural Journal, Ural State University of Agricalture
(Воронина, В. А., & Петрова, О. Г.
БИОТЕРРОРИЗМ. СТРАТЕГИЯ
ЗАЩИТЫ И БОРЬБЫ НА ПРИМЕРЕ АФРИКАНСКОЙ ЧУМЫ СВИНЕЙ. Международный аграрный
научный журнал. Уральский государственный аграрный университет.)
Zawojska, A. (2011) Ekonomiczne
motywy i skutki agroterroryzmu, Roczniki Naukowe Stowarzyszenia Ekonomistów
Rolnictwa i Agrobiznesu 13 (5), 76–81.
Zimmerman, J. et al., (2019) Diseases of Swine, John Wiley &
Sons
Żuber, M. (2012). Katastrofy
naturalne i cywilizacyjne. Wyższa Szkoła Oficerska Wojsk Lądowych im. gen. T. Kościuszki
[1] Taking into account the distance from the first
European outbreak near Poti, Georgia in 2007 to the latest outbreak in
Belgium/Cambodia in the middle of 2019.
[2] Polish original: “Pejsak,
Jurgiel, 2 bratanki, koniec Polskiej Gospodarki”
Andrzej Buda 1 , Andrzej Jarynowski 1,2, Vitaly Belik 2
1 Interdisciplinary Research Institute, Wrocław/Głogów, Poland
2 Institute for Veterinary Epidemiology and Biostatistics, Freie Universität Berlin, Germany
Presented at E-methodology conference, Wrocław, 2019
We analyze temporal dynamics of entertainment industry including literature, music, films and video games. We focus on music and extend our research to other parts of entertainment industry under the influence of technological revolutions, introducing possible analogies between them. Music industry analysis is based on subsequent albums sales time series by artists from statistical point of view, including networks of artists, record labels and producers. The statistical properties of the entertainment industry (including value of the markets, seasonality, products life-cycles) and possible interferences between different parts of this industry under influence of the Internet era are also discussed.
Introduction and motivation
Entertainment industry has always been devoted to human basic needs since
ancient times. The Nine Muses of the Greek Mythology have given an inspiration
to artists, philosophers and individuals for creation. This culture has
accompanied humans on their journeys through life. The people themselves have
created cultural trends and established businesses to satisfy the demand for
culture and influencing the economy. Therefore, cultural products have acted as
a means for giving a cultural voice to people – consumers (Cebula, 2013).
In the present paper we discuss four branches of entertainment industry:
books or literature, films or motion pictures, songs and video games. In the
digital era, computational and statistical methods dedicated to digital traces
of human participation in culture (e.g. Big Data) via so called distant reading
(Moretti, 2013), (Jarynowski, Buda, Paradowski, 2019), are becoming more and
more popular. The whole field of digital humanities has emerged (Eder, et al.,
2013). Based on empirical data, we present several use cases of statistical and
quantitative analysis of the historical data from the above mentioned
entertainment fields. In particular we demonstrate similarities in the
evolution of those fields.
In the XVth century literature experienced a dramatic upsurge due to
invention of earlier printing methods by Gutenberg resulting in the Bible
becoming the bestselling item of all time. The biggest element of the global
entertainment industry belongs to books (value estimated ~143 billion US dollars
(Publishing Standards, 2017)), because books are still able to involve in
formal education at school or after school in adult life. Even the emergence of
innovations by Thomas Edison and Lumiere brothers in phonographic and motion
picture industry of XIXth century or videogames in XXth century did not change
it. There was a rise of novels between 18th and 20th century (Moretti, 2013) –
first in Europe and the last in Africa.
The domination of books has been developed traditionally in the past, and
is still unscathed, despite the Internet era. However, the number of novels in
each country increased in different periods. The stability of domination in
books sales is often based on books series (e.g. Harry Potter or The Lord Of
The Rings, etc.) that may serve as inspiration for directors creating movies.
Remakes are important part of the US motion picture industry (StephenFollows,
2018).
The motion picture industry is worth at least 43 billion US dollars
according to the latest annual reports (Lpesports, 2018). However, on the
Internet era, the contribution of remakes (including prequels, sequels, etc.
(Loocks & Verevis, 2012) in the total number of movies decreases
(StephenFollows, 2018) over the last 120 years of Hollywood. A movie or books
series are the main products traded on these markets with their own fan base.
On the other hand, in music industry, artists could be considered as
a product traded in phonographic market because they all signed contracts with
record companies. Their subsequent albums may be compared to remakes in motion
picture industry and books or video games series (Fig. 1).
In music industry, the role of film director or book author may be played
by record producers who initially were a sound engineer only. However, digital
technologies had impact on the art of sound creation and even deceased artists
are able to “record” new music or put their holograms on well-paid live tours.
Therefore, record producers are as much important as directors in film industry
or authors for books. In book industry, direct communication perspective
between author via narratives (Moretti, 2011) and reader (Jarynowski, Boland,
2013) is very important, so the role of editor is smallest in all creative
industries
Product
Life-cycle
Relationship between agents in creative industry can be described by
Actor-Network Theory (Latour, 2004). Creative market could be represented as a
set of players (artists) managed by their companies –
labels/studios/publishers, who sell products to customers. Sizes of the markets
are limited, and the creative items are characterized as luxury goods in
economic sense. Companies and their artists are supposed to establish the
optimal selling strategy. They can control many factors like release date,
strength of promotion and items quality. From the economical point of view, we
define an artist, film series (even in a single movie a bunch of people are
involved as actors directors, producers, writers, composers), book series and
game series as a product.
Empirical observations (Fig. 1) show that album
sales of an artist (product) reach maximum exactly in the first week of new
item (album) release. Companies often set album release dates (tuning
inter-event times and exact release date) according to potential high sales,
which is defined as an area under the sale curve (Fig. 1). Of course, companies
are going to counteract this decrease by promotional events (in music industry
singles can be released, in books authors readings are useful, etc.).
Fig. 1. A bunch of product life-cycles for the 30 most popular artists (2003-2013). Source: Own graph
We observe symbiotic inference between various creative industries, mainly around books (as Harry Potter movie/book -interfered life cycle of book sales together with film released. and Witcher book/game (Fig. 2)). The Nielsen Company is monitoring such interactions.
Fig. 2. Google Tends of Polish book/game: Witcher (Wiedźmin) Source: Own graph based on Google Trends
Creative industry revenues
Artists gets salary depending on the signed contract and companies
(publisher/studio/label) make business on them. Success of the creative product
can be measured in many ways such as critics opinion, chart position,
popularity in media, etc. Monetary outcome is prioritized in this article, due
to its quantitative character (even it is biased as overrepresenting
high-income populations). E.g. the evolution of revenues of three creative
industries (Movies, Games, and Music) was analyzed in Ref. (Lpesports, 2018)
and a trigging point was revealed (around 2005), when Games revenues exceeded
Music and Movies revenues.
The value of video games industry – estimated to be $109 billion – consists
of mobile gaming – $46 billion, smartphone games – $35 billion, tablet games –
$11 billion, console gaming – $33 billion, digital content – $22 billion,
physical sales – $11 billion and PC gaming – $29 billion. Despite these new
technologies, books market (including e-books) is still the biggest one – $143
billion (Source: Publishing Standards, 2017) and music industry – $30 billion
(including $15 billion because of physical records) and motion picture industry
– $98 billion (including $27 billion from the global Box Office, DVDs &
blue rays – $41 billion and TV copyrights – $17 billion) seem to be
outnumbered. In music industry streaming revenue is 47% of global total and
yearly growth in paid streaming revenues: +33% (IPFI, 2019).
According to annual reports, the largest gaming markets of 2017 were in
China – $36 billion, United States – $25 billion, Japan – 201 billion, and
European Union – $20 billion (Source: Vgames, 2018). On the contrary, the US and
European markets dominate in music industry. According to the IFPI more than
90% of the total revenue of music in 2018 was derived from the 30 major
countries with dominance of USA, Japan and UK and almost neglectable position
of China (IFPI, 2019). Books sales major markets are similar to music
(dominating countries are still USA and Europe (Statista, 2019A)). However,
cinema tickets sales major markets (China is just behind USA) are more similar
to video games (Statista, 2019B).
Eras
In history culture evolved in time (Batist, 2011). New genres come to live, merge, and die. Fashion trends are dynamic (Lorenz-Spreen, et al., 2018), (Cebula, 2013). Device and technology drive revolutional transition in culture (Buda, Jarynowski, 2015b), (Jara-Figueroa, et al., 2019), (Hidalgo, 2015).
These four industries could be divided in general in three Eras due to technological changes:
• pre digital with a dominant role of broadcasting technology and physical supply chain of device;
• digital with digital mean of devices and shortened transporting time (Schneider, et al., 2011);
• post digital with streaming technologies and on demand content.
In detail the following chronology:
Fig. 3. Characteristics Eras in Creative Industries (blue- predigital, green – digital, orange -postdigital) Source: own graph
In entertainment/culture consumption models, we need to consider individualistic consumption (more specific) and tribal consumption (more fashion driven) (Castells, 2011), (Cebula, 2013). In post digital era, for example attending, cinema or concert – social facts are both declining, while video games and streaming on device (individual action) are growing.
There problem of piracy has interfaced selling distributions unequal according to countries industries and given products. Digitalization of devices and Internet sharing of resources gave an opportunity for piracy. Current approach of creative companies as cloud storing (e.g., Amazon kindle), streaming technologies (e.g. Netflix), or external licence management (e.g. Google Play) decreases piracy size. Let consider China case. This country is leading in term of videgames sells (with ~30% of global share) and second in books (~10%) and movies (~15%) markets. However, China almost does not exist on phonographic market (less than 1% of global share (IFPI, 2019)). Cultural difference cannot explain such a difference, so music industry is the most vunerable for piracy.
Current time series of album sales in music (as well as in other creative industries) differ from classic product life-cycles (Stark, 2004) because album sales usually reach their maximum in the first week after premieres (Fig. 1). However, historical time series are similar to standard life-cycle (Rogers, 1965) due to gaining popularity via information diffusion by physical devices (Buda, Jarynowski, 2015b). There are, moreover, symptoms of sales increase one week before the peak because of pre-orders in the Internet era (the same effect can be seen for Harry Potter movie/book. From the marketing (Thomas, 2006) point of view (Fig. 1), on the Internet era (2003-2013), the global phonographic market is over-represented by innovators, early adopters and early majority (Rogers, 1965). Other participants (including customers that are laggards or late majority) are not entirely affected (their seasonal impact may be explained well by stochastic models (Jarynowski, Buda, 2013)). Moreover, an observation of seasonality of items sale (increase of album release late autumn and early winter) is universal (Fig. 4) (Chrismas “madness”). It means that customers wallets approach is crucial to understand that phenomena (after Christmas and New Year Eve people might have less money for such a luxurious good like a creative items). Monthly global video games sales between 2013 and 2018 is increasing with similar seasonal patterns (CNB, 2019).
Fig. 4. Weekly global albums sales [millions of copies] between 2003 and 2013 for the 30 most popular artists defined in (Jarynowski, Buda, 2013) and Fig. 1. Source: Own graph based on data from IFPI reports as (IFPI, 2019)
Interevent time is defined as a time between the release of a new item (it could be a new record of an artist, new book in series etc). In general it is increasing with time. We have analyzed 30 most popular artists album sales trajectories that depend on intervals between consecutive albums premieres (Fig. 5) and found out 2 characteristic time intervals: 1 and 2 years.
Fig. 5. The distribution of intervals (in months) between consecutive albums premieres obtained for the 30 most popular artists defined in (Jarynowski, Buda, 2013) and Fig. 1. Source: Own graph based on data from IFPI reports as (IFPI, 2019)
Analogies between books, movies, music and video games creative markets
Creative industries are characterized by some common properties:
Creative market as a predictable system – in complexity and in particular for a record/movie/book/game;
Creative industry might be considered as a programmable system – agents as record, studios, editors optimaze profits ;
Even unpredictable popularity spread by the Internet do not break the equillibrium (Jarynowski, Buda, 2013) on the market (for example virals as Gangman style in music or Farmville in games);
The system might be unstable in case of artists death only for music and book industry;
There is a strong seasonality, there are fans that buy records/DVDs/books/games every month and occasional clients who buy items just before Christmas;
There is a decreasing trend in selling physical devices of record/movie/book/game which characterize the creative markets all over the world and an increasing trend in streaming or digital copies (itunes, lastFM, Netflix, Kindle store, google play, etc);
The trajectory of items sales has a pick on the release day and decreases exponentially (Fig. 1) with some additional peaks caused by promotion including tours, author meetings, competition etc;
In the past, the peak of item sales has appeared a few weeks after the release, and sales have decreased slowly, but currently the peaks of item sales appear in the first week after the release;
Popularity spreads both via cultural and geographical paths (Jarynowski, Buda, 2016);
Fig. 6. The network of the 30 most popular artists according to labels (evolution, importance) edges defined by belonging to the same label according to consecutive albums between 2003 and 2019. Source: Own graph
These predictable results obtained for music industry might be extended to other data sets. For instance, for the last 120 years of Hollywood movies history, over 6000 films with the corresponding remaking formats (ca. 1700 original films) and ca. 4300 films of various remaking formats) were collected (Loovk& Verevis, 2012). The distribution of intervals between subsequent remakes seems to be multimodal probably like in the music industry (Fig. 5). Moreover, the number production of remakes by studios increases since the beginning of 20th Century and collapses in the year 2005. It means that the Internet era has forced some studios to integrate with others or be eliminated for good. Thus, the number of remakes decreased significantly after 2005. The same process takes places in the music industry when small labels become a part of major labels. Moreover, music and the motion picture industry has the same participants (Universal, Warner, Columbia, etc.). Therefore, since the beginning of the 21th century, the number of major labels has decreased to those four. On the contrary, the value of video games market increases year by year since the early ’80s.
Tab.
1 Analogies between the four main parts of the global
entertainment industry
Books (B)
Films (F)
Music (M)
Video games (V)
Economic product
series
remakes
artists (Fig.6)
series
Economic company
author
director
producer
producer
Economic distributor
publisher
studio
label
studio
Product life-time, agents: predigit
very many pubs
many studios
2 years interv many labs
few studios
Product lif-time agents: digit
many pubs
few studios
1 year interv many labs
many studios
Product life-time agents: postdigit
very many pubs (selfpublishing)
few studios
1.5 year interv few labs
few studios
Inference- predigit
F
B
B
B
Inference- postdigit
V
V
V
B
According to annual reports, books are still the greatest and the most valuable part of entertainment industry. On the Internet era, number of book publishers increases, but the number of distributors decreases. Number of record labels remains constant, but number of distributors decreases. Number of film studios (and connections between studios creating different remakes) increases till 1990’s but in the Internet era (2005) it collapses. In Post-Digital Age (called Internet in music) small companies (labels) are forced to merge or look for non-record related new sources of revenue (Galuszka, Wyrzykowska, 2016).
Summary
Such
analogies within the most profitable 4 parts of the global entertainment
industry may define networks of entities (Tab. 1) represented in a universal
way and detect the importance of the technological eras in the evolution from
historical and economic point of view. In our contribution, we present the
results of quantitative analysis for music records and several results or
analogies with other parts of entertainment industry. Such quantitative and
distance reading approaches promise to provide deep insights into dynamics of
entertainment industry and even to develop predictive models for e.g. revenues.
All of these 4 industries changed their characteristics due to Internet (Tab.
1), (Fig. 3).
Moreover,
all these entertainment industries may interact with each other because of
overlapping fanbase. For example, Lara Croft is the most successful human
videogame character according to the Guinness Book of Records because she has
extended her ‚activity’ from Tomb Raider videogame series to comics, novels,
television, films and soundtracks albums (featuring famous names like Graeme
Revell or Alan Silvestri). On the other hand, The Lord Of The Rings and Harry
Potter series, with their origin in books, have become interactive and
universal too. Star Wars movies have inspired a lot of people to fill the gaps
between consecutive series by creating books and videogames that have been
later authorized by George Lucas. Even the Beatles fans may have occasion to
participate in creating new version of classic songs because of XBOX or jam
together with other musicians online. There are examples of interference among
all four creative markets. The Witcher (originally Polish book series) has
gather international attention in Books, Video Games and recently in Movie
Industry. However, The Witcher music records gather attention only in Poland
(golden record in 2002). Despite blurred boundaries, the economy behind all the
main branches of entertainment industry remains invariant. Therefore, analogies
between main branches of entertainment industry may be detected and unified as
multilayer network elements (cultural dynamics, globalization, commodity
market, etc.).
Acknowledgement
This research was supported by COSTNET (CA15109).
Literature
Babtist JM, et al., (2011) Quantitative analysis of culture using millions
of digitized books, Science, Nr 331 (6014), 176–182.
Ball, P. (2004) Critical Mass – How One Thing Leads to Another
(„particles become people”), New York: Farrar, Straus and Giroux.
Buda, A. and Jarynowski, A. (2010) Lifetime of Correlation and its
applications. Wroclaw: WN.
Buda, A. (2012) Does pop music exist? Hierarchical structure in
phonographic market, Physica A: Statistical Mechanics and its Applications 391
(21), 5153-5159
Buda, A. and Jarynowski, A. (2015A) Exploring patterns in European singles
charts, Network Intelligence Conference (ENIC), 135-139
Buda, A. and Jarynowski, A. (2015B) The global phonographic market: record
labels, artists and fans in the internet era, E-methodology 2, 96.
Castells, M. (2011) The rise of the network society: The information age:
Economy, society, and culture. Vol. 1. John Wiley & Sons.
CNB (2019) Video games seasonality. Retrieved Mai 20, 2019, from
https://www.cnbctv18.com/market/data/video-game-sales-are-extremely-seasonal-1511161.h
Cebula, M.
(2013). Społeczne uwarunkowania gustów i praktyk konsumpcyjnych. Zbieżność
pozycji społecznych i stylów życia czy autonomizacja kultury?. Studia
Socjologiczne, 209(2), 97-125.
Eder, M., Kestemont, M., & Rybicki, J. (2013). Digital Humanities 2013: Conference Abstracts.
Fandom (2017) Video game industry, Retrieved Mai 20, 2019, from
https://vgsales.fandom.com/wiki/Video_game_industry
Galuszka,
P., & Wyrzykowska, K. M. (2016). Running a
record label when records don’t sell anymore: empirical evidence from Poland.
Popular Music, 35(1), 23-40.
Inceoglu, F., & Park, M. (2011). Diffusion of a new product under
network effects: the US DVD market. Applied Economics, 43(30), 4803-4815.
IFPI (2019) IFPI Global Music Report 2018 Retrieved Mai 20, 2019, from
https://www.ifpi.org/news/IFPI-GLOBAL-MUSIC-REPORT-2019
Jara-Figueroa,
C., Amy, Z. Y., & Hidalgo, C. A. (2019). How the medium shapes the message: Printing and the rise of the arts and
sciences. PloS one, 14(2), e0205771.
Jarynowski,
A., & Boland, S. (2013). Rola analizy sieci społecznych w odkrywaniu
narracyjnej struktury fikcji literackiej. Biuletyn Instytutu Systemów
Informatycznych, 35-42.
Jarynowski,
A (2014). Obliczeniowe nauki społeczne w praktyce. Wrocław: WN.
Jarynowski, A., & Buda, A. (2014) Dynamics of popstar record sales on
phonographic market – stochastic model, Acta Physica Polonica B (PS) 2 (7),
2014.
Jarynowski, A., & Buda, A. (2016). Diffusion paths between product
life-cycles in the European phonographic market. Control and Cybernetics,
45(2).
Jarynowski,
A., Buda, A., Paradowski MB. (2019)
MODELLING COMMUNITIES AND POPULATIONS. INTRODUCTION TO COMPUTATIONAL SOCIAL
SCIENCE (accepted to Methodological Studies)
Latour, B. (2005). Reassembling the Social: An Introduction to Actor-Network-Theory.
Oxford ; New York, Oxford University Press.
Loock, K., & Verevis, C. (Eds.). (2012). Film Remakes, Adaptations and
Fan Productions: Remake/Remodel. Palgrave Macmillan.
NetworkDataScience (2019) Quantifying and Comparing
Success in Creative Careers, Retrieved Mai 20, 2019, from https://networkdatascience.ceu.edu/node/519
Pabjan, B. (2010). The Reception of Chopin and His Music in Polish Society.
International Review of the Aesthetics & Sociology of Music, 41(2).
Percino, G., Klimek, P., & Thurner, S. (2014). Instrumentational
complexity of music genres and why simplicity sells. PloS one, 9(12), e115255.
Publishing standards (2017) Global book market valued at $143bn Retrieved Mai 20, 2019, from https://thenewpublishingstandard.com/global-book-market-valued-at-143bn/
Rogers, EM. (1962). Diffusion Of Innovations (1st ed.). New York: Free
Press of Glencoe
Stanisz, T.,
Kwapień, J., & Drożdż, S. (2019). Linguistic
data mining with complex networks: a stylometric-oriented approach. Information
Sciences, 482, 301-320.
Statista (2019A). Share of the total sales of the global book publishing
market in 2017, by country. Retrieved Mai 20, 2019, from
https://www.statista.com/statistics/288746/global-book-market-by-region/
Statista (2019B). Box offices. Retrieved Mai 20, 2019, from
https://www.statista.com/statistics/243180/leading-box-office-markets-workdwide-by-revenue/
Stark J, (2004) Product Lifecycle Management: 21st Century Paradigm for
Product Realisation, Springer, ISBN 978-1-85233-810-7.
Stephen Follows (2018) Remakes. Retrieved Mai 20, 2019, from https://stephenfollows.com/the-prevalence-of-sequels-remakes-and-original-movies
Schneider, C. M., Belik, V., Couronné, T., Smoreda, Z., & González, M.
C. (2013). Unravelling daily human mobility motifs. Journal of The Royal
Society Interface, 10(84), 20130246.
Thomas Jr, G. (2006). „Building the buzz in the hive mind”.
Journal of Consumer Behaviour 4 (1): 64–72. doi:10.1002/cb.158.
Vgames (2018). Video games industry Retrieved Mai 20, 2019, from
https://vgsales.fandom.com/wiki/Video_game_industry